San Diego’s Economy
From life sciences to military and defense, explore the interactive dashboard below and learn more about the makeup of San Diego’s economy. For additional information regarding the dashboard, please see the Traded Clusters Technical Note. Interested in more industry-specific info? Visit our Industry Profiles.
1.6M
REGIONAL JOBS (2023)
$261.7B
GROSS REGIONAL PRODUCT (2023)
$99K
MEDIAN HOUSEHOLD INCOME (2022)
3.2M +
POPULATION
Quarterly Snapshot
Every quarter, San Diego Regional EDC analyzes key economic indicators to provide valuable insights important in understanding the region’s economy.
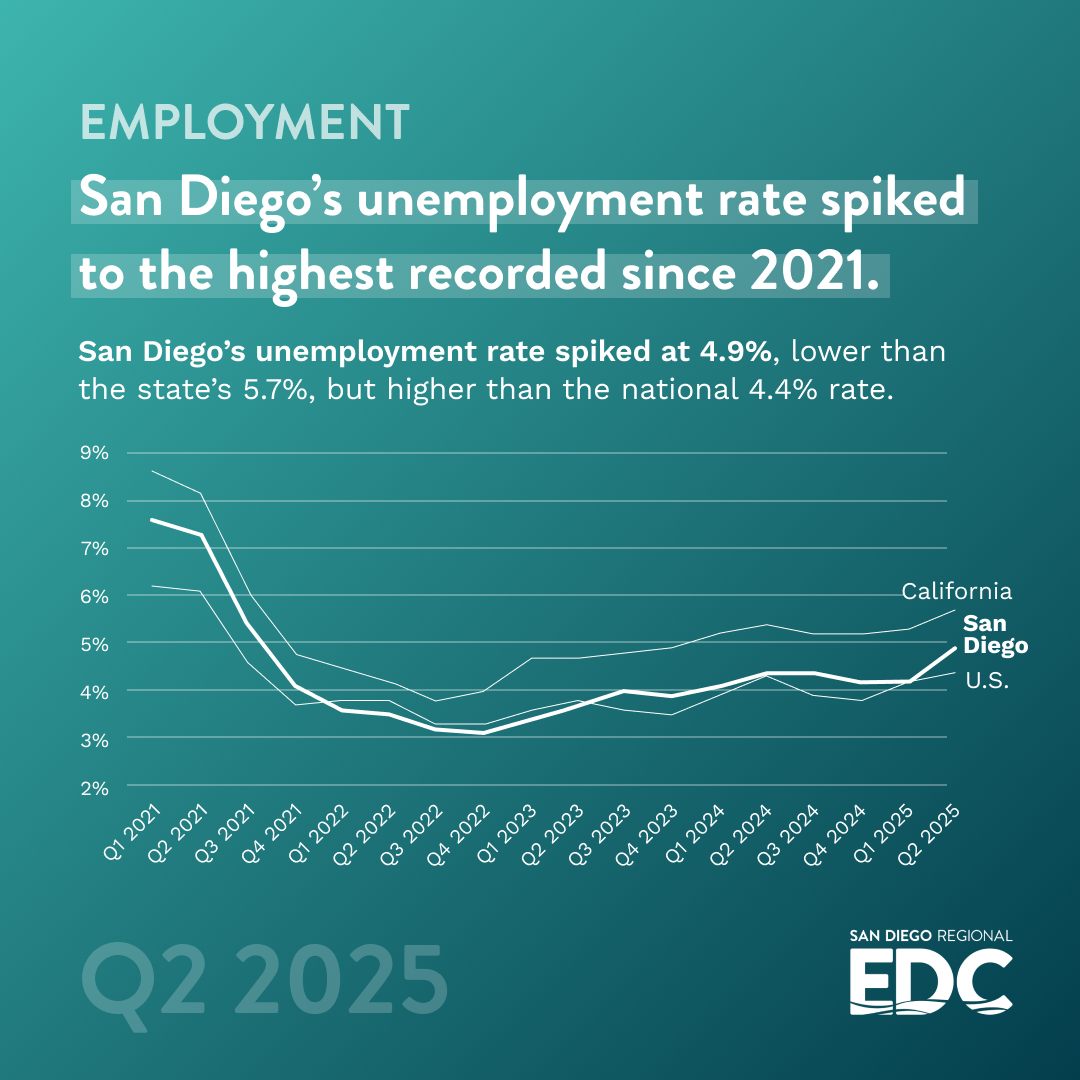
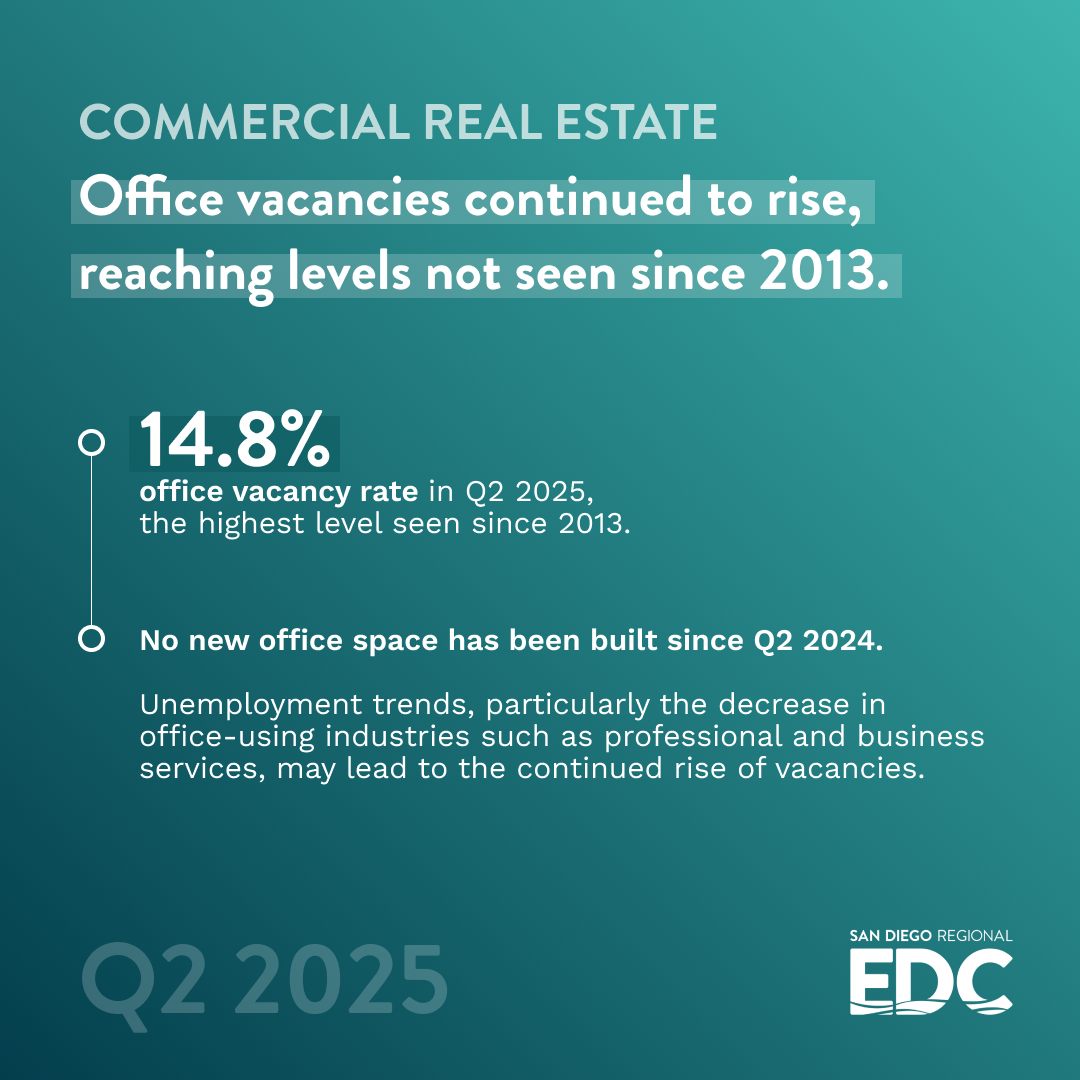
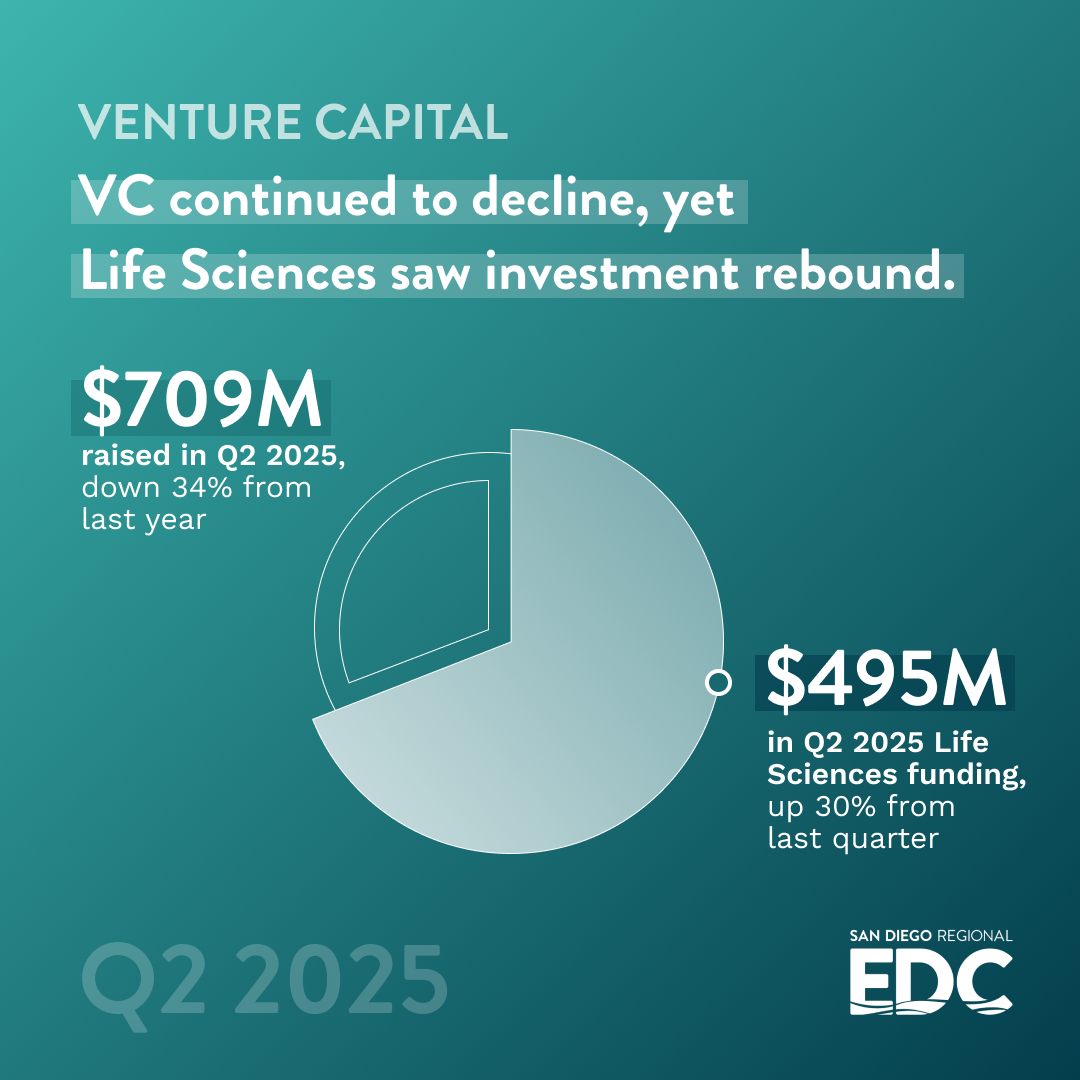
In this issue covering Q2 2025, EDC reports on a spike in unemployment rates, continued office vacancy growth, and a decline in overall venture capital funding—trends reflecting ongoing economic uncertainty.
Get San Diego’s Quarterly Economic Snapshot delivered to your inbox →
EDC explains the data:
scroll over the interactive graphics below to learn more.
Key Industries
With breakthrough technology companies and research organizations, the largest military concentration in the world, and a strong tourism industry, the San Diego region has one of the most dynamic economies in the country. Deep dive into the industries that make San Diego the global innovation hub it is, with data on employment, businesses, wages, and more.
Aerospace
Cleantech
Cybersecurity
Defense
Life Sciences
Manufacturing
Software
Tech
Tourism
Aerospace
Aerospace has a long history in San Diego, dating back to the early 1900s when Ryan Airlines built the Spirit of St. Louis and Reuben Fleet brought Consolidated Aircraft Corporation to Lindbergh Field. Since then, San Diego’s aerospace industry has been an integral part of the region’s—and the world’s—economy. See the Industry Profile.
Cleantech
The San Diego cleantech industry is a collaboration between public, private, and academic organizations working together to deploy IoT technologies and advance urban connectivity to reduce greenhouse gas emissions, increase water and energy efficiency, and drive economic growth in the San Diego region. See the Industry Profile.
Cybersecurity
San Diego has emerged as a leader for the development of cybersecurity technology and the delivery of cyber-related services. The region’s innovation ecosystem, including its strong military presence, world-class academic institutions, incubators, and partnerships between industry associations and governments, has positioned San Diego as a hub for cyber operations. Today, there are nearly 1,000 firms in the San Diego region focused exclusively on cyber, with nearly 26,000 total impacted jobs. See the Industry Profile.
Defense
San Diego’s defense cluster is critical for the region’s innovation and military economies, and ultimately, to the United States’ national security priorities. San Diego is home to the largest concentration of military assets in the world and the largest federal military workforce in the country. When considering the overall ripple effects of the defense cluster in San Diego, about 20 percent of San Diego’s gross regional product (GRP) is the result of defense-related spending. Jobs supported as a result of defense spending include uniformed military, federal government employees, and defense contractors, as well as employees in healthcare, engineering, construction, hospitality, and tourism. See the Industry Profile.
Life Sciences
The life sciences cluster has a deep history in San Diego’s innovation economy, contributing to global advances in pharmacology, genomics, and medical device manufacturing for more than half a century. Seeded by globally-renowned research institutions and fueled by private and public investment, San Diego continues to rank among the top three life sciences markets in the world. See the Industry Profile.
Manufacturing
The San Diego region is home to a vibrant manufacturing cluster that spans many industries, including defense, aerospace, shipbuilding and repair, medical devices, craft brewing, and sports and active lifestyle. With a highly-skilled workforce, robust training programs, and close proximity to Mexico, San Diego is a hub for advanced manufacturing companies, with more than 4,429 manufacturing establishments currently supporting more than 121,027 jobs. See the Industry Profile.
Software
With more than 3,100 software establishments and more than 100 research institutions in the region, the technology industry is a major driver of the innovation economy in San Diego. The research institutes—along with UC San Diego, San Diego State University, and other major universities—provide the sector with breakthrough technologies that fuel company growth and product development. These unique assets, combined with one of the most skilled labor forces in the world, make San Diego one of the most innovative markets in the U.S. See the Industry Profile.
Tech
A world leader in wireless technologies, San Diego companies are driving local and global innovation that keep us all connected. Founded in San Diego in 1985, Qualcomm invented technologies at the heart of 3G and 4G wireless and the first smartphone, and continues to pioneer new technologies ranging from 5G to artificial intelligence. See the Industry Profile.
Tourism
With more than 70 miles of coastline, state of the art hotel and convention spaces, and an array of entertainment options, San Diego is one of the top visitor and convention destinations in the world. Dubbed by Fodor’s as a “vacationer’s paradise” and by the U.S. Weather Bureau as “the closest thing to perfect weather in America,” San Diego’s world-class waterfront and award-winning international airport make it accessible from destinations across the globe. See the Industry Profile.
Why San Diego?
Situated next to the busiest land port of entry in the Western hemisphere, San Diego is home to more than 3.3 million people and offers incomparable opportunities for business of all sizes to thrive. From sequencing the human genome to inventing the next wave of 5G technology, San Diego has the talent and expertise to change the world—and the numbers to back it up.
EDC Research
EDC provides research and data to local companies, site selectors, and civic leaders to help them make well-informed decisions about our economy. For companies outside of the region considering San Diego for expansion or relocation, EDC provides a variety of assistance, including responding with formal proposals (RFPs) to professional site selectors.
EDC Deep Dives
![Artificial Intelligence]()
Artificial Intelligence
![Life Sciences]()
Life Sciences
![Technology]()
Technology
Maps & dashboards
EDC provides data-driven, Geographic Information System (GIS) mapping tools like the San Diego Investment Map, District Insights Map, and Community Explorer to support strategic decision-making for local officials, businesses, and constituents. These maps offer insights on income distribution, worker concentrations, housing, childcare, and site selection, helping drive inclusive economic development aligned with EDC’s 2030 goals.
Explore the tools below:
San Diego Investment Map
District Insights
Community Explorer
San Diego Investment Map
The San Diego Investment Map is a tool designed to support the Thriving Households goal in EDC’s 2030 Inclusive Growth framework, informing strategic decision-making related to childcare, housing, and site-selection. Explore brief reports, maps, and a dashboard to see how data-driven decisions can boost San Diego’s inclusive economic development. See the San Diego Investment Map.
District Insights
The District Insights Map is a dashboard that generates specific insights for the nine City Council districts in the City of San Diego. The tool is embedded with data related to income distribution, worker concentrations, housing permit activity and development, and more. This dashboard allows users to select and export data, as well as compare data between districts. Explore the District Insights Map.
Community Explorer
Contact EDC to access the Community Explorer, a tool designed to generate data insights on specific geographies, especially related to corporate site selection. This EDC service can help you leverage a range of aggregated data surrounding communities of interest, pin-point addresses, selected regions, or specified drive-times or walk-times from a desired location. Demo below:
A note about our research
EDC currently does not endorse specific ballot measures or candidates. From time to time, we provide objective research on the economic impact of specific measures or proposals to better inform the public and policymakers on a project’s potential economic impact. If you are interested in working with EDC on customizable research, contact us.
Questions? Contact:

Eduardo Velasquez
Sr. Director, Research & Economic Development