Each quarter, EDC’s Research Bureau releases its Economic Snapshot to analyze key economic indicators in San Diego’s economy. Read on as we dig deeper to assess the region’s job recovery journey in a post-pandemic economy by looking at economic trends through the end of 2023.
San Diego’s job recovery journey
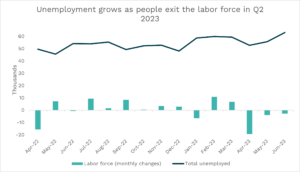
As San Diego’s unemployment rate has remained up and above the national average, at 4.3 percent and 3.5 percent respectively, and as job growth has slowed compared to early 2023, it is worth examining the region’s progress recovery in a post-pandemic economy.
From March to April 2020, San Diego lost 233,900 jobs, and employment dropped by 18.5 percent causing the unemployment rate to spike to 15.7 percent. In November 2021, the region officially recovered the total number of jobs lost during the pandemic. While recovering lost jobs is an indicator of a healthy economy, it does not tell the whole story. The following explores San Diego’s employment data to understand where the region stands as of the end of 2023.
Not all industries are created equal
While San Diego has regained the total amount of lost jobs, this is not the case for each industry. Total employment in San Diego stands two percent higher than at the onset of the pandemic. However, more than half of industries in San Diego don’t currently match pre-pandemic employment levels. Top growing industries such as Utilities, Transportation, and Healthcare help offset other sectors that are lagging in job growth.
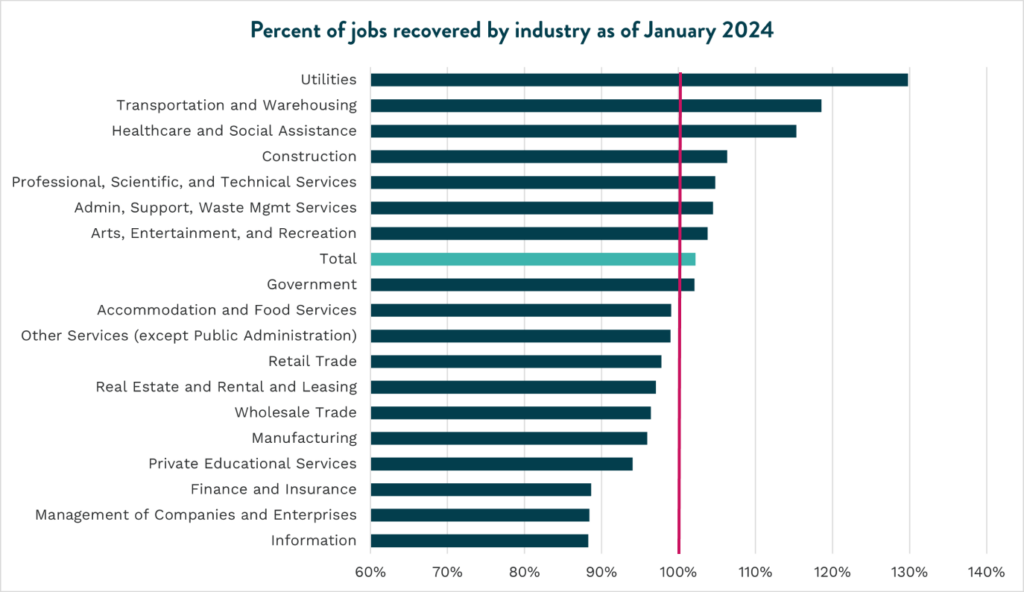
Comparing current employment levels relative to pre-pandemic numbers is not always a reflection of recovery. Such is the case for Finance and Insurance, which made up for pandemic-related job losses by December 2020, but currently sits at 5,300 jobs under original pre-pandemic levels. In fact, several other industries initially recovered pandemic job losses and now find themselves with lower total employment. This includes Retail Trade, Real Estate, Accommodation and Food Services, and Management of Companies.
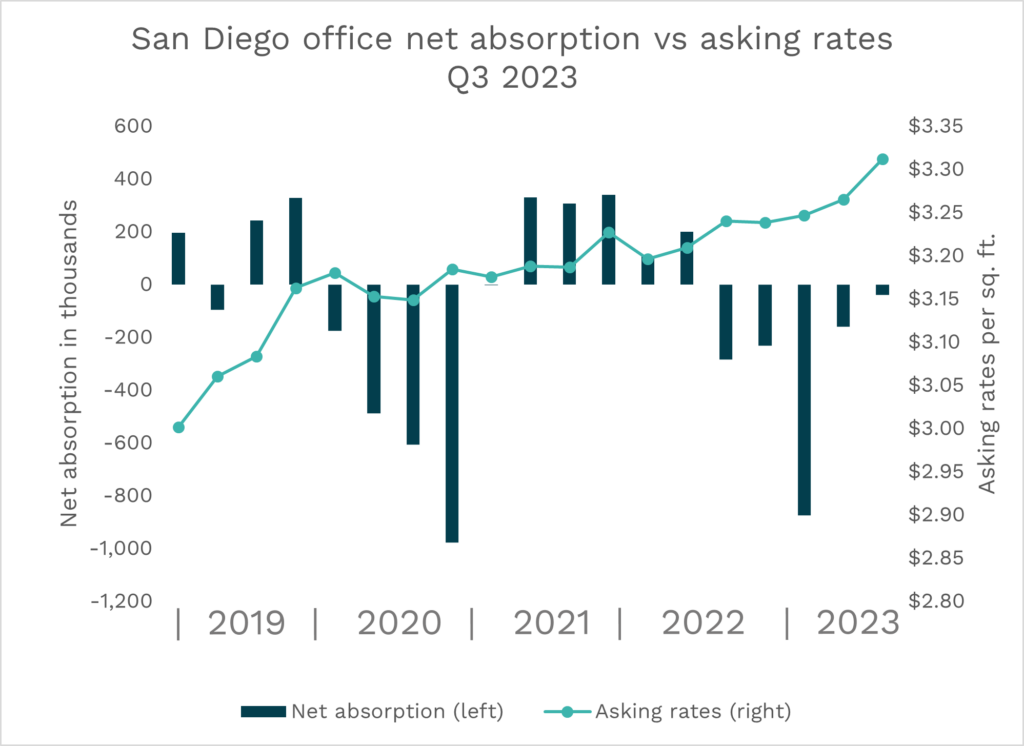
While it is hard to assume this negative trend is related to pandemic effects, the new conditions it spurred can potentially have a lagging impact on employment across sectors. For example, as remote work trends have become more prevalent, commercial real estate is affected as firms continue to reduce their office footprint, which could potentially lead to a lower demand for commercial real estate talent. In 2019, remote job postings made up only eight and four percent of total job postings in Finance and Information, respectively. In 2023, those proportions grew to 26 and 15 percent.
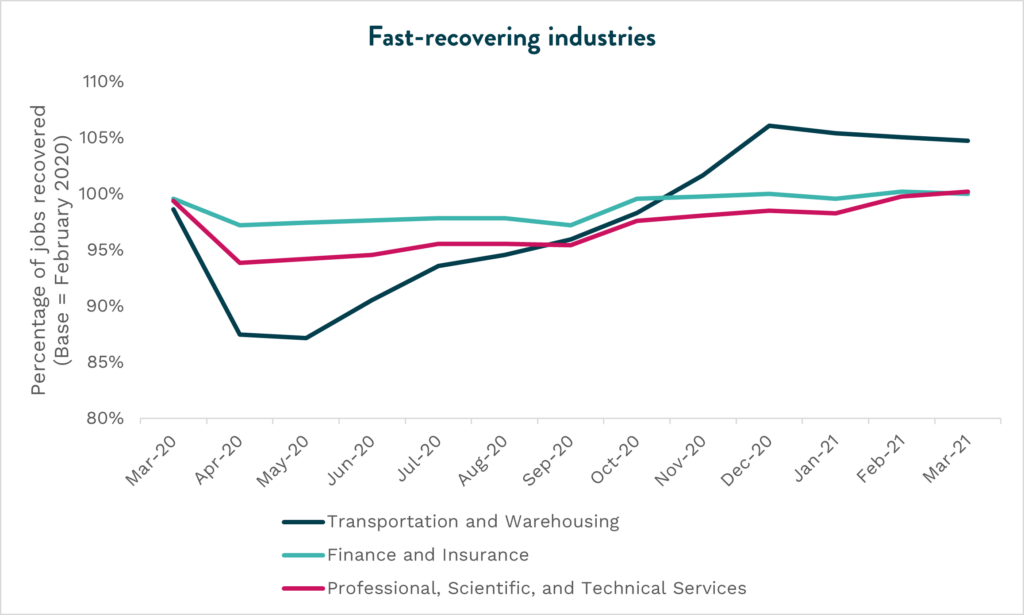
The industries that recovered the fastest are Transportation and Warehousing in November 2020, followed by Finance and Insurance in December 2020, and Professional, Scientific, and Technical Services in March 2021. Employment in the Utilities industry was hardly impacted after March 2020, which might explain why it has added the most jobs since the pandemic started.
What if the pandemic didn’t impact jobs?
While jobs have been recovered, the pandemic has also impacted the job growth that would have occurred absent the pandemic. Before the COVID hit, San Diego’s annual employment growth rate was averaging at 1.1 percent. This typical annual growth rate was disrupted in 2020, as annual employment fell by 10 percent.
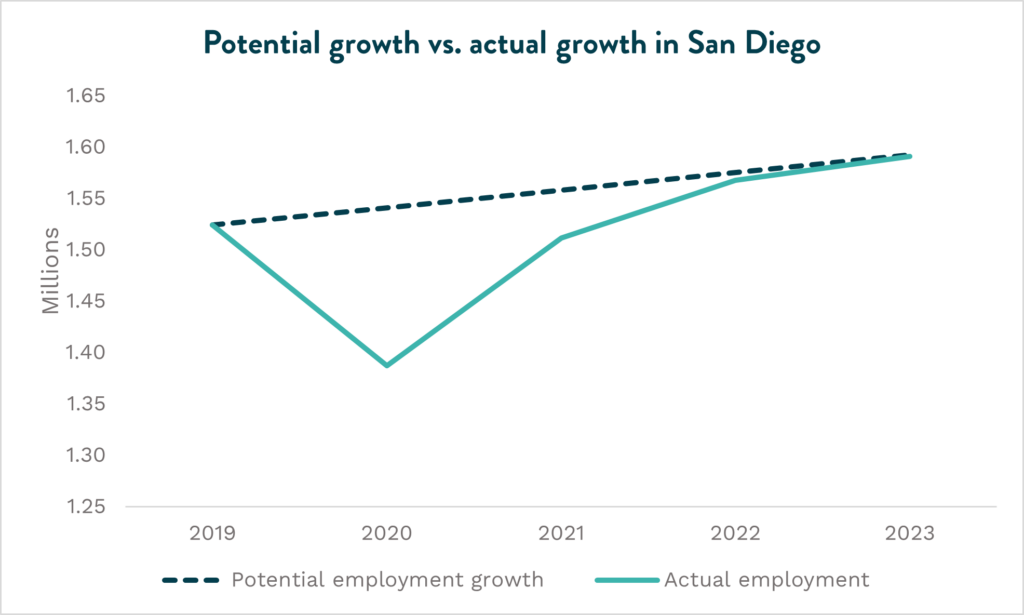
To get an idea of where employment would stand today if jobs had not declined amid the pandemic, we apply the average growth rate from 2019 to 2023. Below, we can see how this potential growth compares to the actual annual employment levels in San Diego. From this, we see that the region is still 1,488 jobs below the potential growth, assuming employment has been growing at a fixed annual rate of 1.1 percent. This recovery had a significant economic impact on the region beyond number of jobs. In 2020, the annual growth of San Diego’s gross regional product (GRP) was barely 0.1 percent, while the annual GRP growth rate in 2021 and 2022 was 10 percent.
San Diego relative to California
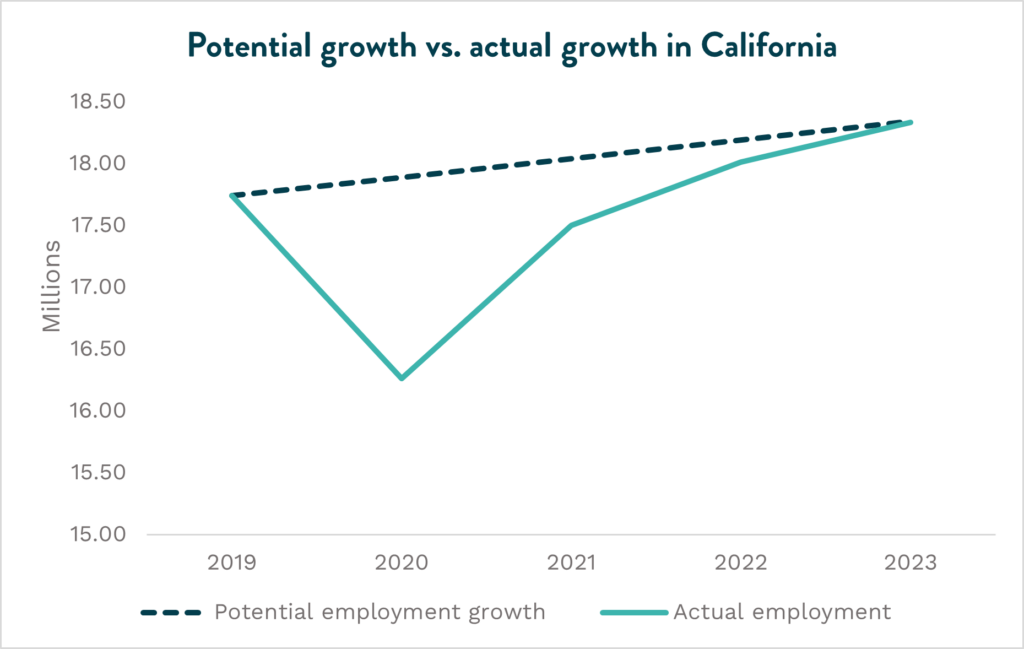
While San Diego has not fully closed this gap between actual employment and potential employment growth, it is ahead of the state. This aligns with the fact that San Diego’s unemployment rate has remained below California’s throughout the pandemic until now. Additionally, the region was able to reach pre-pandemic labor force levels back in 2022, while the state remains 1.57 percentage points below 2019 participation.
Where does San Diego stand?
While San Diego’s recovery from pandemic employment impacts is not over yet, it is very close to completion at a macro level. However, it is important to monitor individual industries as their employment trends differ from one another. Even after San Diego is aligned with its potential growth, there will likely be industries falling behind; some might even experience new disruptions due to emerging economic conditions in a post-pandemic economic climate.
When comparing to California, the region has held a stronger position and experienced an overall faster recovery, with lower unemployment rates, faster labor force growth, and more rapid return to potential growth.
Learn more in our Quarterly Economic Snapshot

Sofia Nelson-Ferezi
Manager, Research
You might also like to read: