I hope this message finds you well as we close out the first quarter of 2026. It was a shaky and unpredictable quarter for the region and the nation in so many ways. Yet through it all, our team at EDC continues to draw great inspiration from all of you as you stay committed to the success of your companies and to the health of the communities around you.
We know through our own research and data that important elements of San Diego’s economy are competitive and growing. However, we also know that we are facing a challenging inflection point: Our current growth is running parallel to the region’s persistently high cost of living, wide income gaps, and the ability for all San Diegans to live comfortably and thrive.
Simply put, our progress is not outpacing our problems. And that isn’t something to run from or ignore—but rather something to face and resolve.
As San Diego continues to see some gains toward its 2030 Inclusive Growth goals—increasing quality jobs within small businesses, increasing post-secondary education completions, and enabling more thriving households—our long-term success relies on both economic and inclusive growth. Still, and always. Without focusing on both, we risk losing talent to more accessible regions, constraining local spending, corroding our robust innovation economy, and stalling our (global) competitiveness for the future.
I invite you to explore our recently released 2030 Inclusive Growth Progress Report. The results are mixed, but the path remains clear. Every challenge presents us with an opportunity, and every opportunity puts us one step closer to a prosperous and sustainable future for our region.
With gratitude and respect,
Mark Cafferty
President & CEO
San Diego Regional EDC
In April 2026, San Diego Regional EDC released its annual Inclusive Growth Progress Report, using the most up to date and available data (2024). With new progress and bold objectives set around increasing the number of quality jobs, skilled talent, and thriving households critical to the region’s competitiveness, the report measures San Diego’s growth and future outlook, and spotlights the greatest threats to prosperity.
San Diego’s economy is competitive and growing—with a GRP in 2024 that reached nearly $267 billion, 2.1% higher than in 2023, making it one of the largest county economies in the United States. This value reflects production across San Diego’s key industries including defense, tech, manufacturing, life sciences, and tourism. Yet this growth runs parallel to San Diego’s persistently high cost of living, wide income gap, and stratified opportunities across racial groups. To maintain the region’s competitiveness, the benefits of growth must be felt by more San Diego households.
Smart economic development requires sustained and intentional attention to both the region’s immediate economic growth and inclusion. To guide San Diego’s economic development priorities, EDC alongside the Brookings Institution, established an Inclusive Growth Framework. Launched in 2018 and updated annually, this initiative set ambitious goals tailored to San Diego’s unique economy and communities to achieve by 2030:
Key takeaways
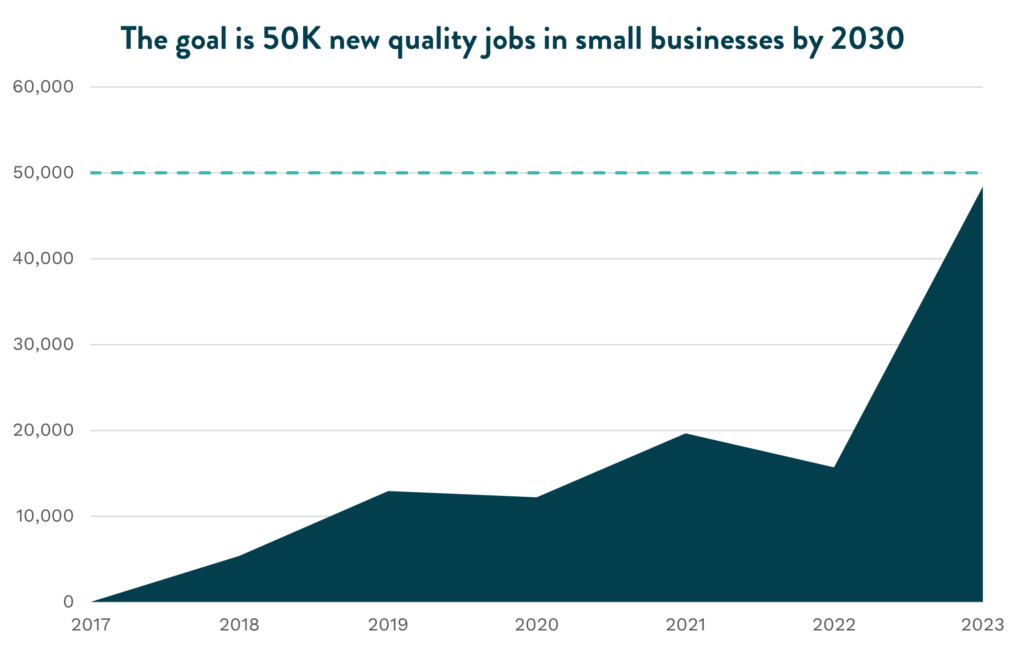
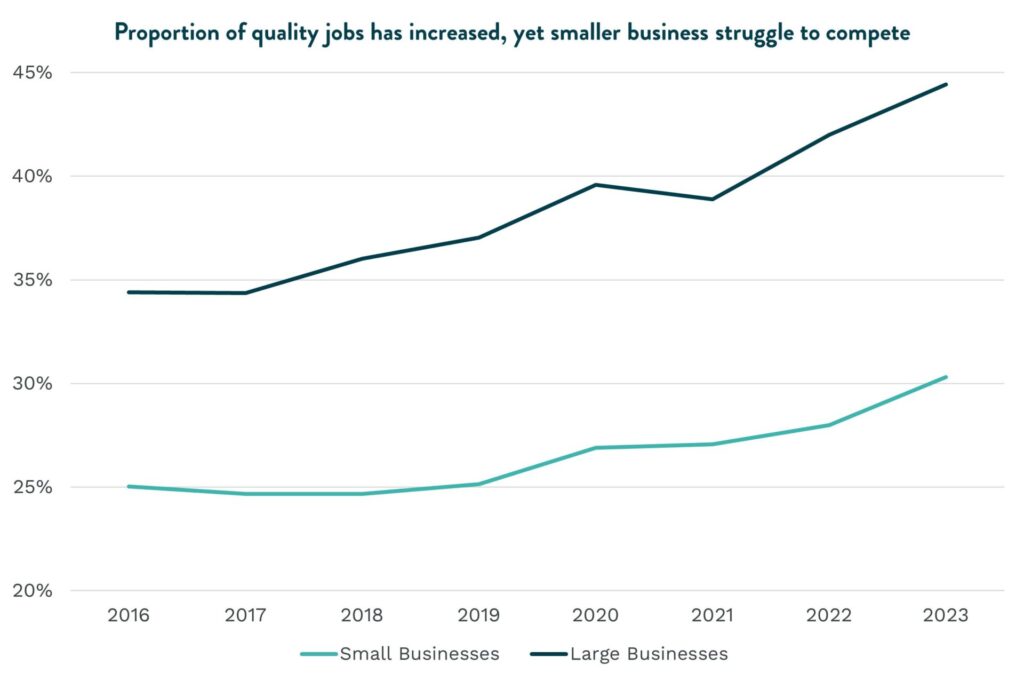
With more quality jobs in small businesses, San Diego is 87% of the way to meeting the 2030 goal. With sustained growth since 2017, the region now has a total of 228,087 quality jobs in small businesses. However, the overall proportion of quality jobs across all small businesses remains low at 28%.
More students are succeeding, yet the region remains around 7,000 students away from the 2030 goal. Further, only 21% of those completing a post-secondary degree are Hispanic and Latinx students despite representing 49% of current K-12 students, highlighting the persistence of racial and ethnicity disparities in accessing opportunities to develop in-demand skills.
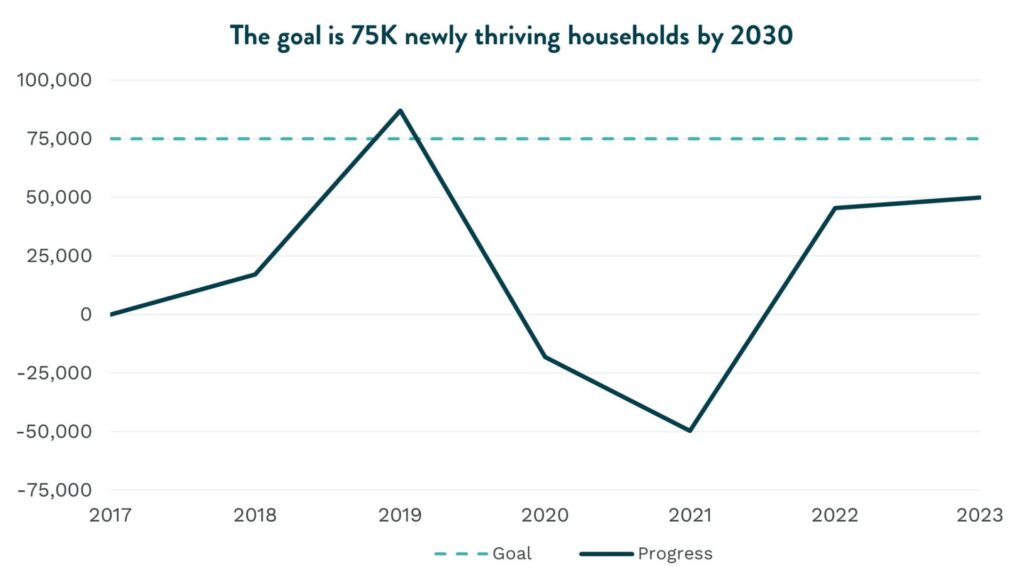
San Diego has added 38,158 newly thriving households, fewer than last year and nearly 37,000 households away from the 2030 goal. Although household income continues to grow, it is still not enough to meet the cost of living—particularly for housing—in San Diego.
The Inclusive Growth initiative is sponsored by Bank of America, County of San Diego, JPMorganChase, Lifeline Community Services, Prebys Foundation, SDG&E, and Southwest Airlines.
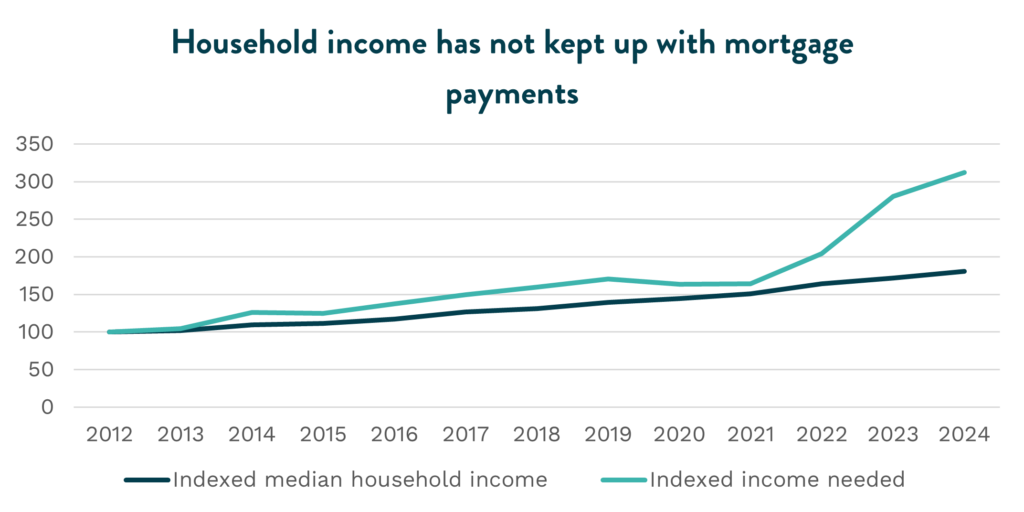
San Diego has continued to show progress in reaching our Inclusive Growth goals with 2024 median household income experiencing a 29 percent increase since 2019. Despite promising recent growth in annual earnings across the county, San Diego remains one of the most expensive metros in the U.S. By the end of 2024, households needed an income exceeding $235,000 to afford the median-priced home, a threshold that, combined with elevated interest rates, places homeownership further out of reach for most San Diegans.
On average, homeowners faced housing costs of $4,748 per month in 2024, 55.5 percent higher than 2019 costs. Because household income growth has failed to keep pace with the cost of living, the gap between local housing costs and incomes continues to widen despite home prices stabilizing.
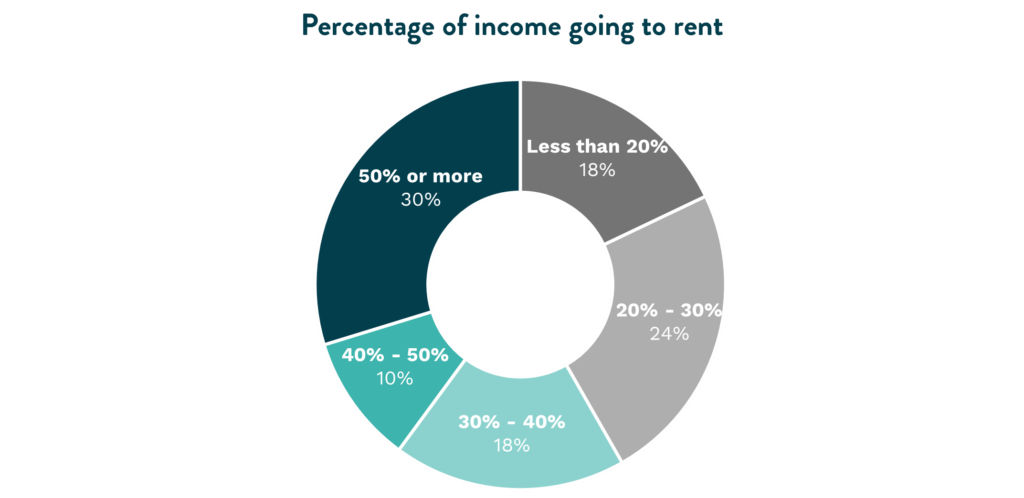
Renters face similar pressures. Average rent prices reached $4,039 in 2024, increasing by 8.3 percent over a year and 38 percent over five years. As household income struggles to catch up to increasing prices, 58 percent of renters remain cost-burdened, spending more than 30 percent of their income on rent.
Progress toward the goal
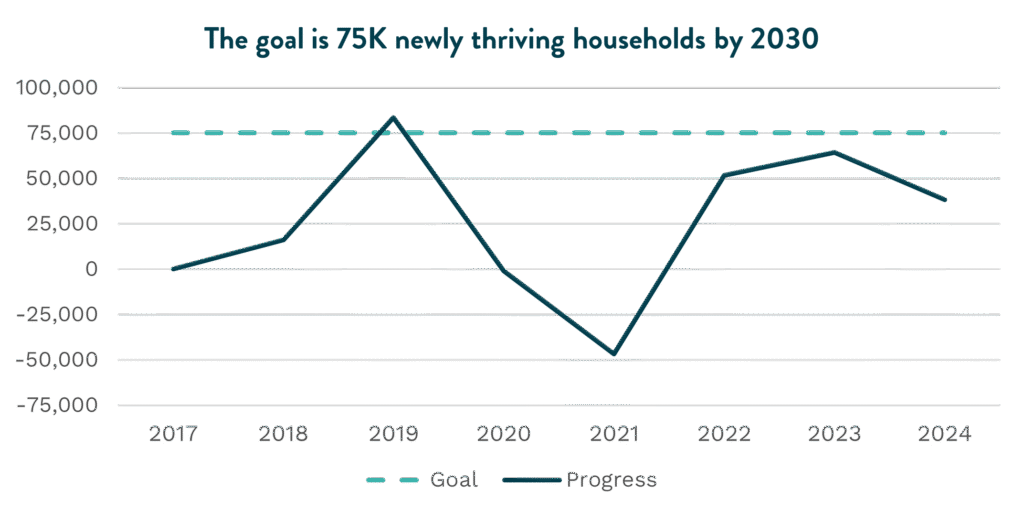
By the end of the decade, EDC estimated the region would need to add 75,000 newly thriving households. To be considered ‘thriving’ in 2024, a renter-occupied household needs at least $84,816 in household income per year, while a homeowner-occupied household needs $139,872 per year.
As of 2024, San Diego has added 38,157 newly thriving households since tracking began—a decrease from 2023 levels. The decline reflects eroding household purchasing power amid continued price pressures on essential goods including housing, groceries, and energy.
Addressing the supply challenge
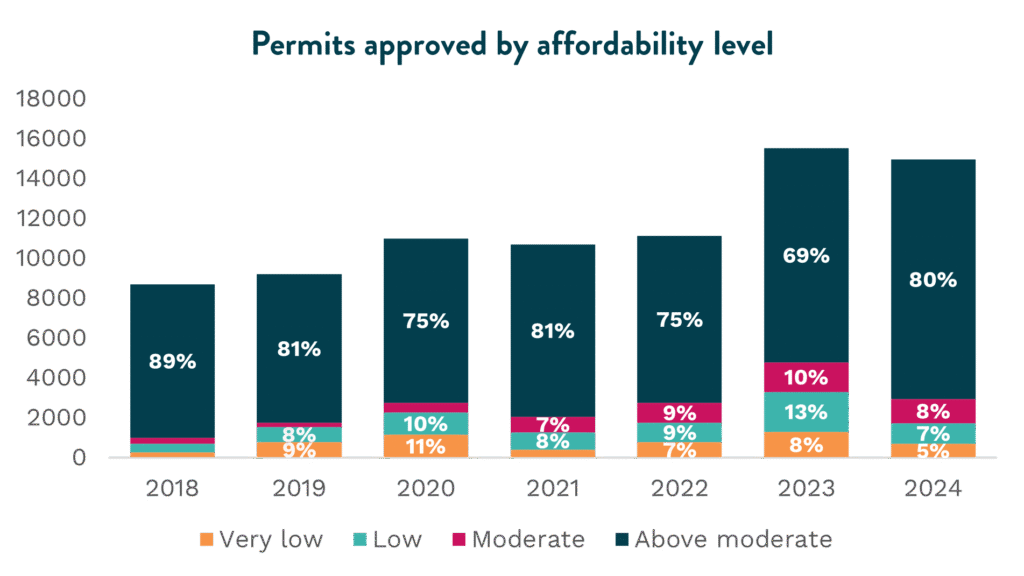
To increase housing supply, local jurisdictions have made notable progress in streamlining permitting processes. Nearly 15,000 housing permits were approved in 2024, demonstrating continued momentum despite a slight decrease from 2023. However, the number of permits for moderate income housing dropped by 18.8 percent, highlighting the persistent challenge of the “missing middle” and insufficient affordable housing production. Furthermore, permits for low and very low income households dropped 47.4 percent compared to 2023.
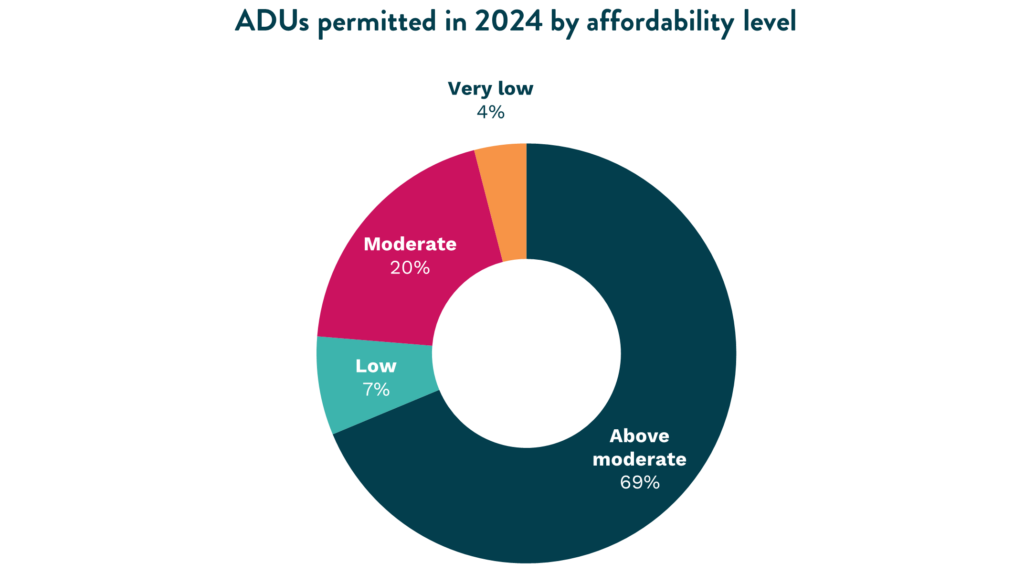
Accessory Dwelling Units (ADUs) represented nearly 27 percent of all permits approved in 2024—up from 22 percent in 2023—and 66 percent of all permits approved at moderate level pricing. However, those priced above moderate continue to make up most of ADU permits. While ADUs offer an opportunity to increase housing stock in existing single-family home lots, they’re unlikely to solve the region’s housing crises alone.
Developers cite several obstacles hampering housing production. The multifamily development market has become oversaturated, reducing incentives for new entrants. Current policies favor small units that do little to address the scale of San Diego’s housing needs. Rising construction costs, coupled with high insurance premiums and litigation risks, have the power to prevent projects from ever breaking ground.
At a broader level, California continues to experience a decline in construction employment, with a 1.9 percent annual decrease in 2024. This could be a potential contributing factor to slowed construction in coming years. This is especially relevant in states like California where the construction workforce is particularly reliant on immigrant workers. In fact, 40 percent of the construction workforce is comprised of foreign-born labor, potentially affecting construction-related labor under the current immigration enforcement landscape.
Extended timelines from permitting to groundbreaking further diminish project viability. Addressing these barriers will require better incentives for risk-taking and access to more flexible financing options.
Creative solutions for persistent challenges
Recent announcements signal significant office space vacancies in downtown San Diego. Major real estate firms including the Irvine Co. have been divesting San Diego office towers since 2024, reflecting broader shifts in the commercial real estate market. This challenge presents an opportunity.
Converting vacant office space into housing could revitalize areas where commercial properties no longer contribute meaningfully to the local economy. However, conversion costs can be prohibitively high. In many cases, demolishing outdated office buildings to construct multifamily housing may prove more economically feasible.
Similarly, conversions of single-family home lots into multiple single-family lots could have significant impact on housing affordability. According to LISC’s single family lot size reduction analysis, allowing multiple townhomes on one single family lot could lower home prices by 42 percent. Additionally, if 1.4 percent of the City of San Diego’s current single family lots were allowed to build multiple townhomes on one single family lot, the amount of new property taxes generated would be approximately $450 million each year, just for the County of San Diego. These innovative efforts require streamlined permitting, supportive re-zoning, and infrastructure assessment from local governments.
Identifying which vacant office properties are suited for conversion—or demolition and redevelopment—should be the first step. Addressing San Diego’s supply-constrained market will require strong public-private collaboration and regional strategies to explore innovative solutions at the scale needed to meet the region’s housing demands.
In February 2026, EDC’s Thriving Households Roundtable provided an opportunity to discuss employer-led solutions to these pressing challenges and to hear about innovative initiatives from local leaders such as LISC, cREate Development, and Center for Housing Policy and Design.
Last month, EDC’s Vice President of Economic Development and Research Eduardo Velasquez reminded us that San Diego stands at an inflection point—where technological transformation is colliding with long‑standing economic challenges in ways previously unseen. His note highlighted a region defined by promise and pressure: Slowing innovation‑sector job growth, rising household incomes shadowed by affordability constraints, and AI reshaping the very nature of work.
A month into 2026, more questions than answers remain, especially when it comes to talent: What is the role of post-secondary education in our changing region? How is AI shifting jobs and industries? And what does this mean for San Diego’s early career talent, our region’s leaders of tomorrow?
Built on talent—but facing new realities
San Diego’s economic engine has always been its people. With more than 100 research and education institutions, our region has long produced the skilled talent that fuels innovation, defense, life sciences, and advanced manufacturing.
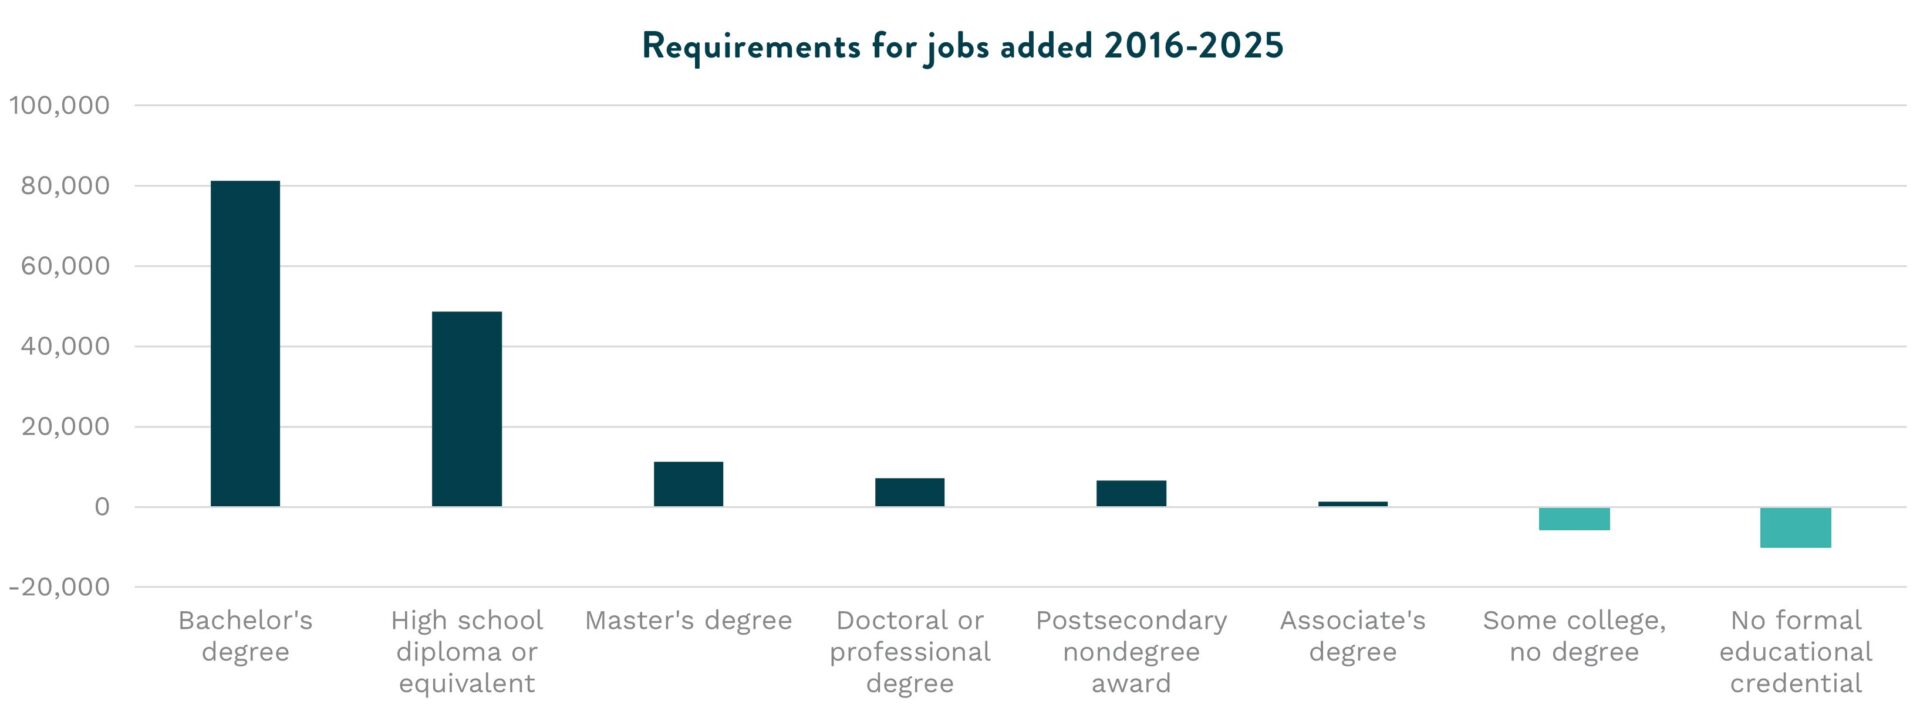
The good news: More San Diego students are completing degrees and credentials than ever before. The region has sustained progress in completions, even as the pandemic’s long‑term impacts remain murky. But the data also makes one thing clear: Post-secondary education is more critical than ever. Jobs requiring a bachelor’s degree or higher continue to grow at a significantly faster rate than those requiring less education. In fact, in 2025, San Diego added six times more jobs requiring a bachelor’s degree or more versus those requiring an associate degree or less.
Additionally, the growth of legacy industry clusters that have served as the backbone of San Diego’s global competitiveness—tech, life sciences, and manufacturing—is slowing down. While bright spots remain in emerging industries like cleantech and aerospace (namely defense technology) that are critical to the region’s future competitiveness, transformations in these industries and varied levels of AI integration represent significant changes to the entire U.S. economy. Their effects will ripple throughout the whole workforce.
Take the cleantech industry, for example, as policy-backed efforts to decarbonize in California are leading to more electrification. As buildings modernize, we might expect increased need for electricians, while the need for gas-line plumbers decreases. The auto mechanic historically focused on combustion engines must now become familiar with hybrid and electric motors. And the manufacturing company that embeds machine learning and automation now requires a person who can analyze and tell a story with the resulting data.
A future workforce that doesn’t yet see a future
Across the U.S., young college‑educated workers are facing a “unique convergence of structural forces” that have severed traditional entry points into white‑collar work.
AI is accelerating this shift. Automation and augmentation are happening within jobs, not just across them. The occupations where automation potential is high are the same ones where augmentation potential is high—meaning AI may not necessarily eliminate an occupation, but rather transform how an employee executes their tasks.
With lower barrier to entry tasks most exposed to automation, the entry-level or new graduate workforce risks being edged out of opportunities to launch. Meanwhile, the nature of the tasks exposed to augmentation will require mid-level workers to continue upskilling to remain competitive.
As for long-term impacts? It’s too early to tell. San Diego’s labor market data does not yet reflect an overhaul of entry-level roles. Job growth across innovation industries at all levels has declined over the last few years, and while entry-level job growth has declined slightly faster, it has not been the job elimination of our nightmares.
What remains constant in our conversations with employers across industries and occupations is a need for soft skills that will never be automated. Skills like communication, empathy, and problem solving are more fashionable than ever. In fact, this demand has been so persistent that workforce developers and educators have taken to calling these “durable” skills—though figuring out how best to cultivate them in students may be the next great challenge.
In a time of transitioning tech, too, regional employers are doubling down on opportunities to future-proof their workforce. We’ve heard from San Diego companies that are making a deliberate effort to traditionally train early career employees in the skills AI could support, both to strengthen institutional knowledge and develop future leaders. And local tech heavyweights are continuing to proactively invest in both tomorrow’s talent and technology, maintaining internship programs that convert as many as three in four interns to full-time roles and leveraging new technologies early to instill technical skills in the emerging workforce.
Lean in with us
To meet these challenges, EDC is doubling down on initiatives that align education, industry, and talent. Through regional and even national partnerships, we will continue to facilitate work-based learning like internships and apprenticeships, and equip the region to better understand its labor market needs.
Here’s how you can lean in:
Host a summer intern from a Verified Program: All intern hosts will work with an employer of record and have access to a pre-vetted batch of resumes. Small businesses may qualify for interns’ wages to be subsidized or fully covered. Learn about our Advancing San Diego internship program.
Hire from Verified Programs in San Diego: These local programs are employer-verified for teaching in-demand skills as well as serving a diverse student population. To connect with a Verified Program, reach out to EDC.
Help us collect critical regional talent data: With so many remaining questions, it has never been more important for training and education institutions to keep a pulse on future talent demand. Our talent data dashboard, annual talent survey, and talent demand reports help local education programs prepare San Diegans with the skills your company needs. If your company is experiencing shifts in talent needs, we want to hear about it.
San Diego’s future workforce is diverse, ambitious, and full of potential—but only if we build the systems that allow every resident to participate in and benefit from our innovation economy.
Your collaboration and investment—whether through hiring, training, curriculum partnerships, or direct support of EDC initiatives—continues to ensure that San Diego can cultivate the talent that creates, attracts, and retains cutting‑edge companies, strengthens our innovation clusters, and secures San Diego’s economic future.
As another year begins, I sit with my crystal ball once again to see what we can glean from the data we’ve received this past year and what implications it may have for our region’s economic growth in the year ahead.
The past year told a complex story, driven by uncertainty. On the surface, the U.S. economy performed remarkably well, achieving 4.3 percent real GDP growth in Q3 2025, representing an acceleration from a year ago. But this growth has been buoyed by unprecedented investment in AI led by a handful of companies, potentially masking deeper structural shifts beneath the surface.
The U.S. achieved this growth while creating just 584,000 jobs—roughly one-third the rate seen in the past decade. And while San Diego gained its fair share, adding 5,800 jobs through November 2025, all our job growth was principally concentrated in higher education, healthcare, and local government.
In 2026, San Diego stands at an inflection point—one where technological transformation collides with traditional economic challenges in ways we haven’t seen before.
Innovation industries are losing steam
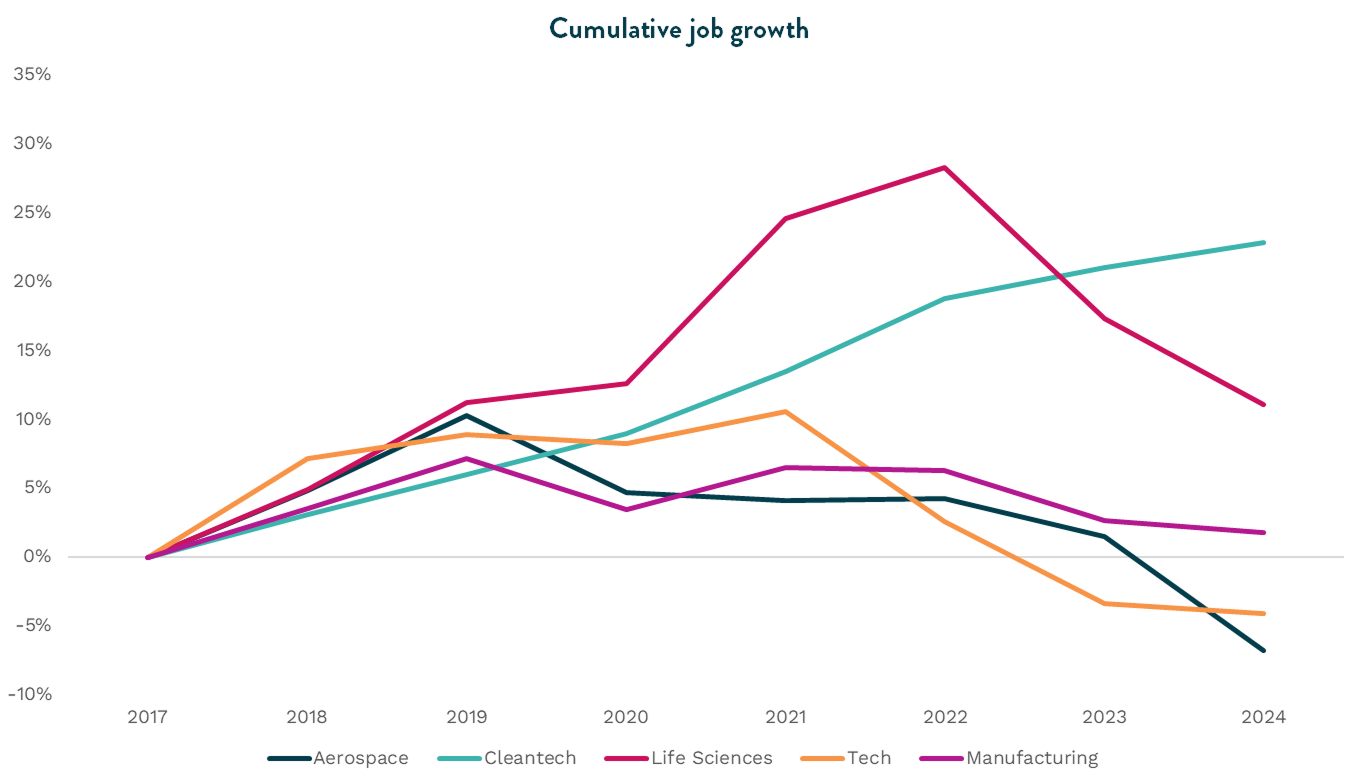
Our region’s innovation engines—the traded clusters that have long defined San Diego’s competitive advantage—are sputtering. Cumulative job growth across aerospace, life sciences, tech, and manufacturing has plateaued or declined from pandemic-era peaks. Cleantech continues to add jobs, though it represents a smaller sliver and is also growing at a slower pace than in previous years. More concerning, it’s not just leaner firms we’re seeing, but fewer firms altogether. Firm growth across these key industries has stagnated, with only defense tech startups providing a bright spot in an otherwise sobering picture.
This matters because innovation industry jobs have an outsized impact on our economy, with each added job supporting another two jobs elsewhere in the economy. When these jobs contract, the ripple effects are significant.
So what’s going on? In part, it’s a tale of structural transformation. Professional, scientific, and technical service jobs, which our innovation cluster relies on, declined 3.3 percent through November 2025. Meanwhile, an additional 550,000 square feet of office space were vacated during the year, bringing total vacant space to 11.3 million square feet in a year with zero new construction. 2025 showed our region’s economy is increasingly dependent on fewer knowledge workers and thus less office space to host those workers.
Yet, investment is happening. Nationwide, construction spending toward data centers is set to eclipse that of traditional office buildings—a trend that accelerated dramatically after ChatGPT’s release. Infrastructure investments are building for servers, not people.
AI is picking up the slack, for now
Amid this disruption comes a silver lining—AI may be delivering what all new technologies promise: Productivity. Looking at inflation-adjusted average wages as a proxy for productivity growth, San Diego’s innovation industries have recovered from the pandemic. AI may be responsible for this recovery, enabling workers to do more with less. This could help explain the decline in local job postings, which fell six percent in 2025.
The question is whether this productivity boost translates into broader prosperity or simply allows companies to operate with smaller teams.
San Diego’s talent landscape reflects this uncertainty. While the value of a degree has been questioned more than perhaps any time in history, it still brings higher income and greater job security in our region. In the past decade, more than twice as many local jobs have been added that require a bachelor’s degree or higher than those requiring associate’s degrees or less. This trend accelerated in 2025, with jobs requiring bachelor’s degrees or higher outnumbering others by a factor of six.
Yet, new graduates are struggling in a job market that increasingly favors experience alongside credentials. The national unemployment rate for young college graduates stands at 4.8 percent, up more than a percentage point compared to before the pandemic.
The market signal is clear: Disruption continues to favor those with degrees and experience, even as the nature of work itself transforms.
Affordability is not a hoax; it’s an enigma
Incomes are up and people are spending their money, but they’re not happy about it. That’s because the essentials like housing, childcare, energy, and transportation continue to get more expensive—local energy prices, for instance, are up nine percent year-over-year as of November 2025.
Housing affordability remains the single biggest threat to regional prosperity. While San Diego’s median household income has increased 25 percent since 2020—a welcome development—the cost of homeownership has far outpaced these gains. The median-priced home fell slightly to $990,000 in Q3 2025, requiring a household income of $263,000 to afford the monthly mortgage payment. Even those looking to rent are facing an average monthly outlay of $2,900, which makes San Diego one of the most expensive counties to rent in the nation.
There’s a glimmer of hope: San Diego home sales increased 14 percent year-over-year in September 2025, suggesting some movement in a frozen market.
Yet meaningful housing market recovery will remain elusive until mortgage rates drop substantially enough to free homeowners locked into historically low rates or make room for significant new supply.
The year ahead
These trends—the pace and composition of job growth, AI’s impact in the demand for talent, and housing affordability—will define San Diego’s 2026.
Can we leverage regional strengths to capture new growth opportunities, particularly in defense tech where startups show momentum? Will hiring priorities shift to tap new pools of talent as employers rethink what it means to be a skilled worker? How do we make room for more housing in a region where working families are increasingly priced out, while the office is increasingly empty?
The answers aren’t in my crystal ball.
They require deliberate action through an intentional, inclusive economic development agenda. We must make sure our region—and our state—is a place that not only cultivates great ideas but also enables the realization of those ideas into solutions, products, and jobs. We must make it easier for builders to build infrastructure and easier for businesses to do business.
In 2026, EDC will work to position San Diego as the destination for defense tech investment, build pipelines to better address employers’ evolving talent needs, and identify opportunities to replace unused office with much needed housing and infrastructure for working families.
But we can only do this with and through you—our partners across industry and academia, local and state government.
Now more than ever, our goal remains constant: To maximize San Diego’s economic prosperity and global competitiveness through meaningful partnerships with our 150+ investors and regional stakeholders. We know where we are and where we need to go. Getting there in 2026 will require resolve, creativity, and bold action—together.
In October 2025, San Diego Regional EDC released “Catalyzing CA’s Fusion Advantage: Roadmap to Commercialization,” an interactive web report quantifying the economic impact of California’s fusion energy industry and exploring its potential to support more than 40,000 jobs and $125 billion to the state economy.
With electricity demand rising and climate targets tightening, the world is facing an impending energy crisis. These challenges, combined with grid instability and geopolitical vulnerability, have underscored the need for groundbreaking commercial technologies, as well as coordinated policy and regulatory frameworks to harness the state’s full potential.
The same process that powers the sun, fusion energy has long been considered the “holy grail” of power: A clean, safe, and virtually limitless source of baseload electricity. It offers high power density, no carbon emissions, minimal and short-lived radioactive waste, no risk of meltdown, and 24/7 reliability.
California has already begun to establish itself as a global leader in the fusion energy industry. The presence of industry titans such as General Atomics and TAE Technologies, coupled with world-leading R&D institutes like Lawrence Livermore National Laboratory (LLNL) and UC San Diego’s fusion cluster, positions the state as one of the world’s most promising regions for fusion commercialization. These institutions also host two of the nation’s most significant fusion research facilities—General Atomics’ DIII-D, the only operational fusion user facility in the country, and LLNL’s National Ignition Facility, where the first successful ignition proved that fusion energy is possible.
“With the right support, California can lead the in the commercialization of fusion energy, capturing the economic benefits that come from it while reshaping the global energy landscape,” said Eduardo Velasquez, Sr. Director of Research and Economic Development at San Diego Regional EDC, the report’s author. “EDC’s report brings into focus the regions, firms, and talent currently driving the industry, as well as the opportunities and hurdles the state faces in scaling from fusion R&D hub to a production powerhouse.”
Informed by nearly two dozen executive interviews with fusion business leaders, academia, and local governance, the report—available at fusionCA.org—dives deep into current industry strengths, future growth scenarios, and policy recommendations needed to drive industry competitiveness in California.
KEY FINDINGS
California leads the nation in fusion energy development. The state boasts 16 core fusion companies—more than one-third of all U.S.-based fusion companies—and has captured more than $2.2 billion in cumulative private and public funding since tracking began.
The fusion industry already generates significant economic impact—with even more high-growth potential. Currently, fusion energy accounts for approximately 4,700 jobs across California and generates $1.4 billion in annual economic output. The industry has the potential to grow to between $48 billion and $125 billion, depending on successful commercialization and state policy decisions.
California excels in research but faces commercialization challenges. The state’s world-class universities, national laboratories, and private investment ecosystem position California as the global leader in fusion R&D. However, barriers such as regulatory uncertainty, high land costs, grid interconnection delays, and lack of fusion-specific policy frameworks threaten California’s ability to retain companies as they transition from R&D to commercial deployment.
Maintaining fusion leadership requires strategic policy measures and state support. Success depends on recognizing fusion as ‘clean energy’ under state law, establishing clear regulatory pathways, preparing appropriate sites for establishing commercial research centers and fusion energy plants, and creating coordinated policy support. Without decisive action, California risks losing fusion companies to other states offering more favorable commercialization conditions.
“As a leader in climate resilience, California has been at the cutting edge of energy transition strategies and innovation for decades. Now, as fusion presents such clear economic opportunity, our state must build a long-term policy roadmap that prioritizes and incentivizes research, commercialization, workforce development, and investment to further position us to lead in the global energy transition,” said California Senator Catherine Blakespear, Chair of the Environmental Quality Committee.
“We’re proud to play a key role in advancing fusion energy here in San Diego while collaborating with partners such as the State of California, the City of San Diego, the Department of Energy, the University of California system, and national laboratories,” said Anantha Krishnan, senior vice president for the General Atomics Energy Group. “To realize our region and state’s full potential, California companies will need financial incentives, regulatory support, and streamlined land-zoning processes. In addition, public-private collaborations to build test facilities and train the future fusion workforce will be critical to achieving success in commercializing fusion energy.”
The report was underwritten by General Atomics, with research contributions by Boston Consulting Group and sponsorship by B3K Prosperity, LLNL, Livermore Lab Foundation, Mintz, ML Strategies, and Tokamak Energy, and unveiled at a press conference and industry reception October 9. Congressman Scott Peters, Senator Catherine Blakespear, and other leaders across the state were in attendance.
In May, San Diego Regional EDC hosted its quarterly convening on the Inclusive Growth goal focused on skilled talent. With more than 50 leaders from private companies, educational institutions, and nonprofit organizations, the discussion focused on creative ways to grow San Diego’s innovation economy workforce. Participants engaged in critical conversation about the ways work-based learning, credit for prior experience, and new forms of education funding will help the region reach its skilled talent goal.
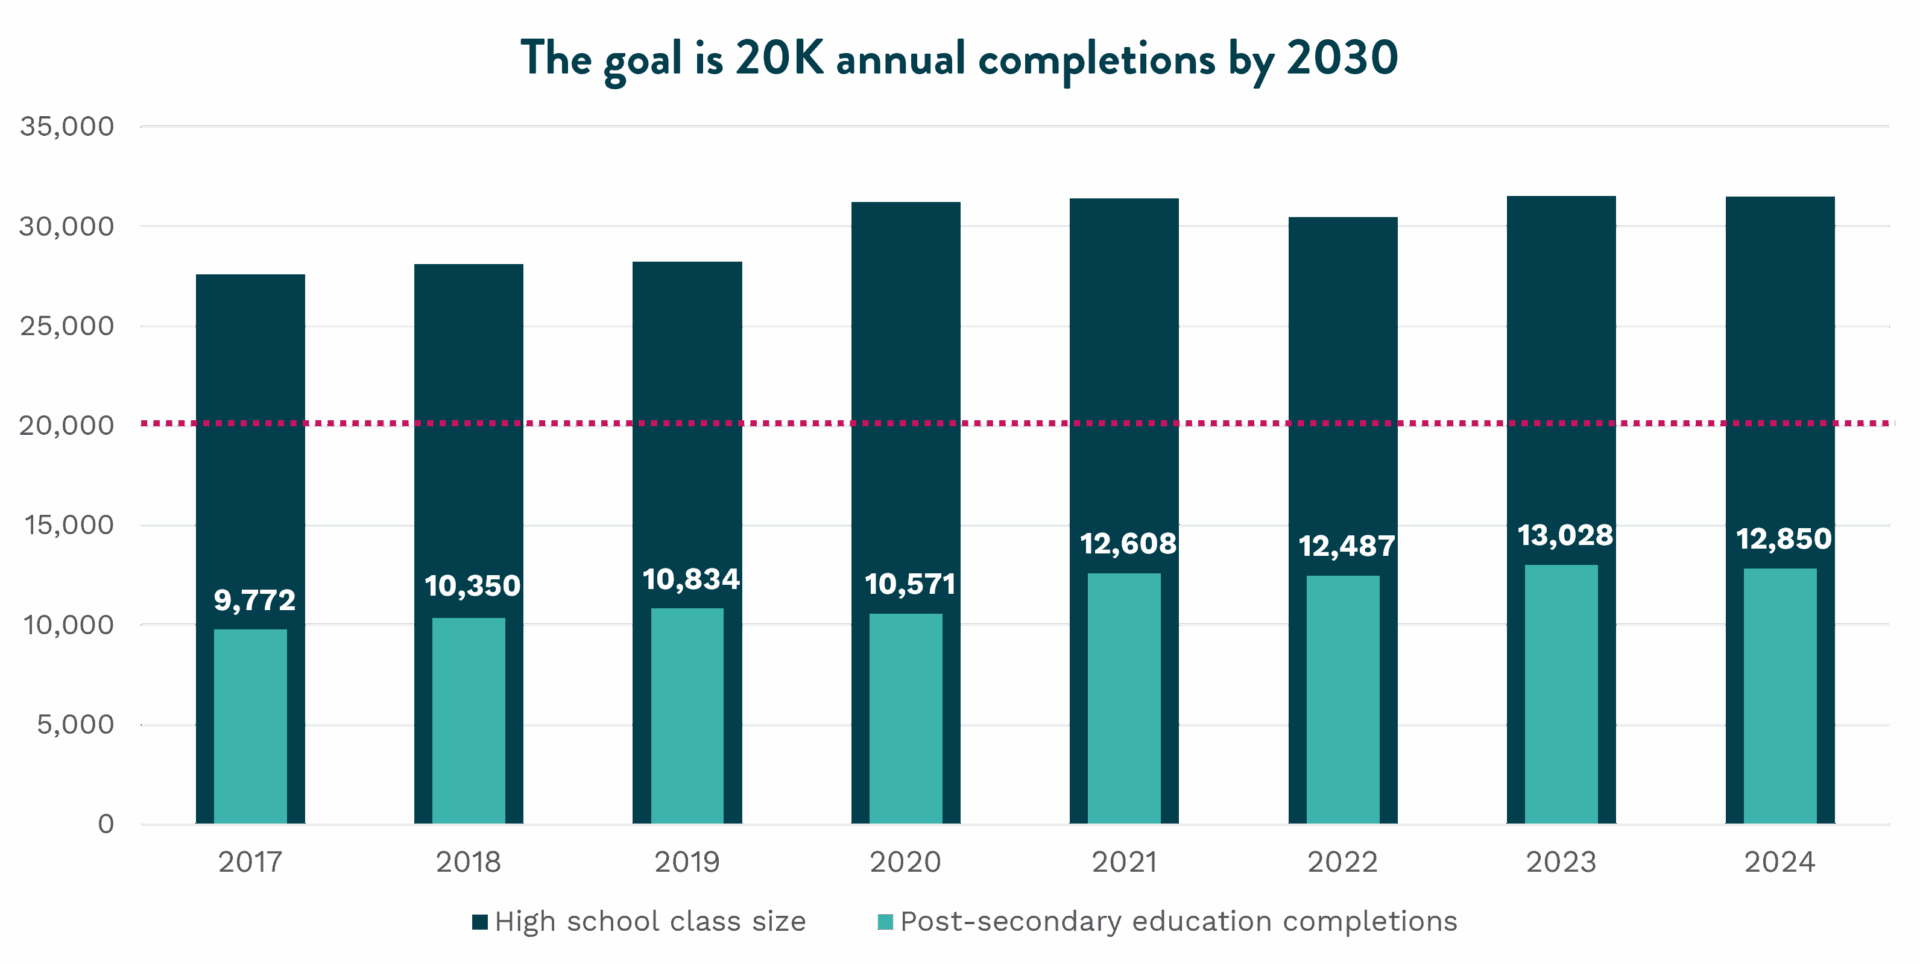
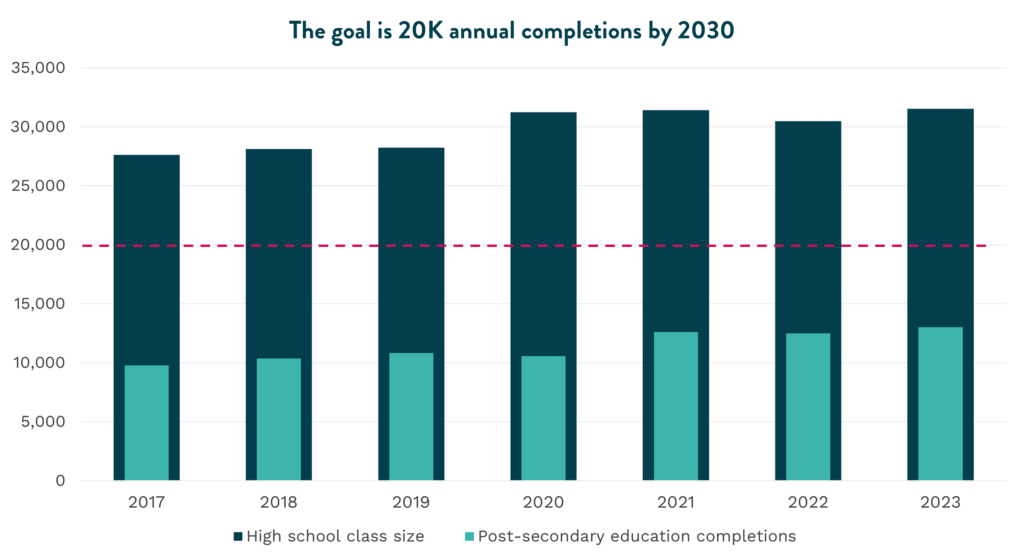
Within the Inclusive Growth framework, the talent goal is the only one measured in annual cohorts. Each year, EDC tracks the number of San Diegans completing a post-secondary education within six years of high school graduation. The goal is to see 20,000 newly skilled workers in San Diego each year.
Post-secondary education completions include certificates, associate’s degrees, bachelor’s degree and post-graduate degrees. The data focuses on students that completed high school in San Diego County, capturing their post-secondary completions regardless of where they went after high school graduation. The goal is driven by two factors:
A thriving innovation economy and evolving technology in every sector mean that most of the jobs being added to the economy require a post-secondary degree.
As San Diego’s high cost of living continues to threaten talent attraction into the region, it is crucial to ensure access to quality jobs for current residents.
For a full breakdown on the purpose of the goal, take a look at the original report.
The goal update
Of the 31,510 students that graduated from a San Diego high school in 2018, 12,850 of them had completed a post-secondary education by 2024. While we did see a one percent decrease from the last report, completions have generally remained consistent following the largest recorded increase from 2020 to 2021. We are not yet seeing the impacts of the COVID pandemic, and likely will not for another two years.
San Diego K-16 Students have sustained PSE completion rates
A double-click into degree completions
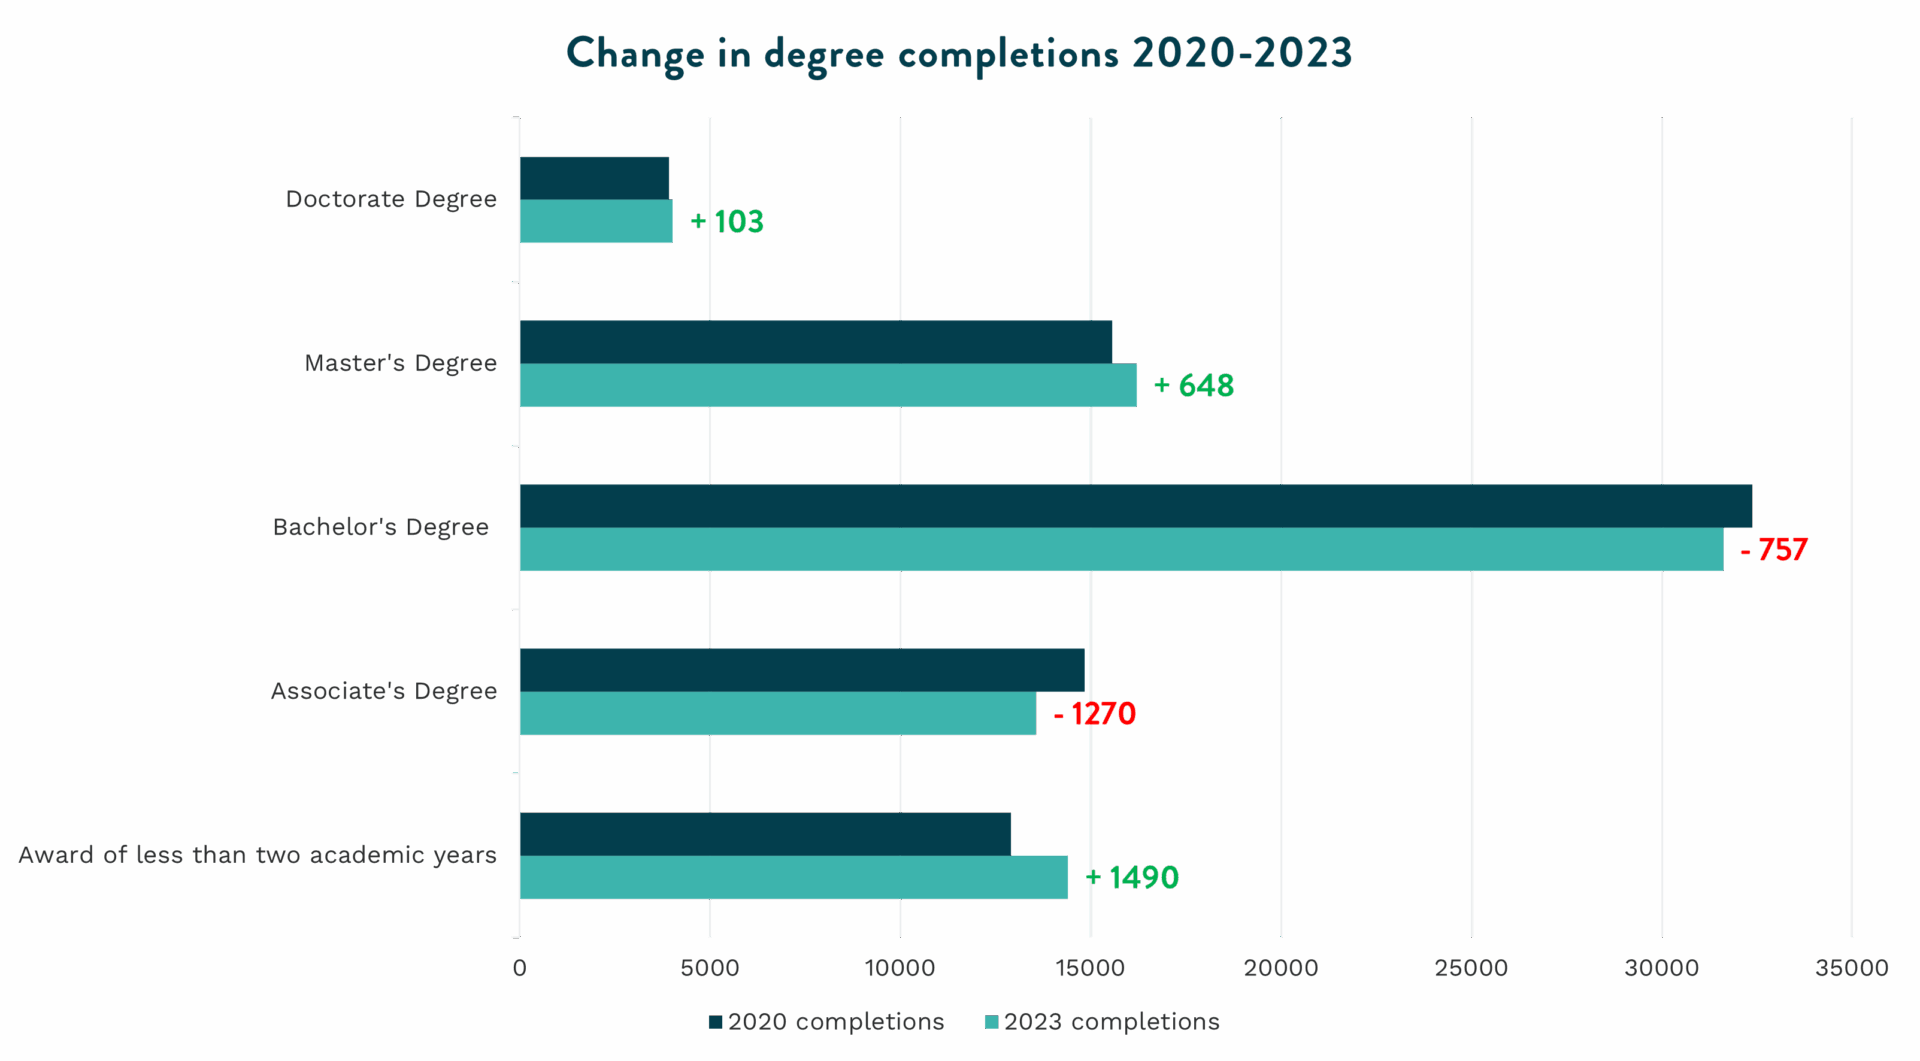
When we look one layer deeper at the students that completed a post-secondary degree by 2024, the data reveals good news for San Diego. The demographic distribution of degree-completers is generally reflective of the region’s demographics, and the areas of study are evenly distributed, with Business Administration boasting the highest portion of graduates. Nevertheless, when comparing the types of degrees conferred from 2020 to 2023, there was a decrease in bachelor’s and associate degrees and a significant increase in awards of less than two academic years. With most of the jobs being added in San Diego’s innovation economy requiring a bachelor’s degree, there is a crucial need for stackable credentials. These credentials would allow certificate holders to follow the path to a bachelor’s degree but offer the option to pause along the way while still being qualified for a good job.
The ability to move between the education system and a career is a win for everyone involved. Employers often struggle with unrealistic expectations or an inability to apply theory when hiring people from the academic system with little to no time in industry. On the student side, the cost of getting an education can be a barrier to student completion. Many people benefit from programs that are broken up into more “bite-size pieces,” allowing them to save up between sections/courses. Notably, education institutions that receive additional funding for successful student completion are able to count the same person multiple times when programs are broken up into smaller pieces. This opens the door for more funding opportunities.
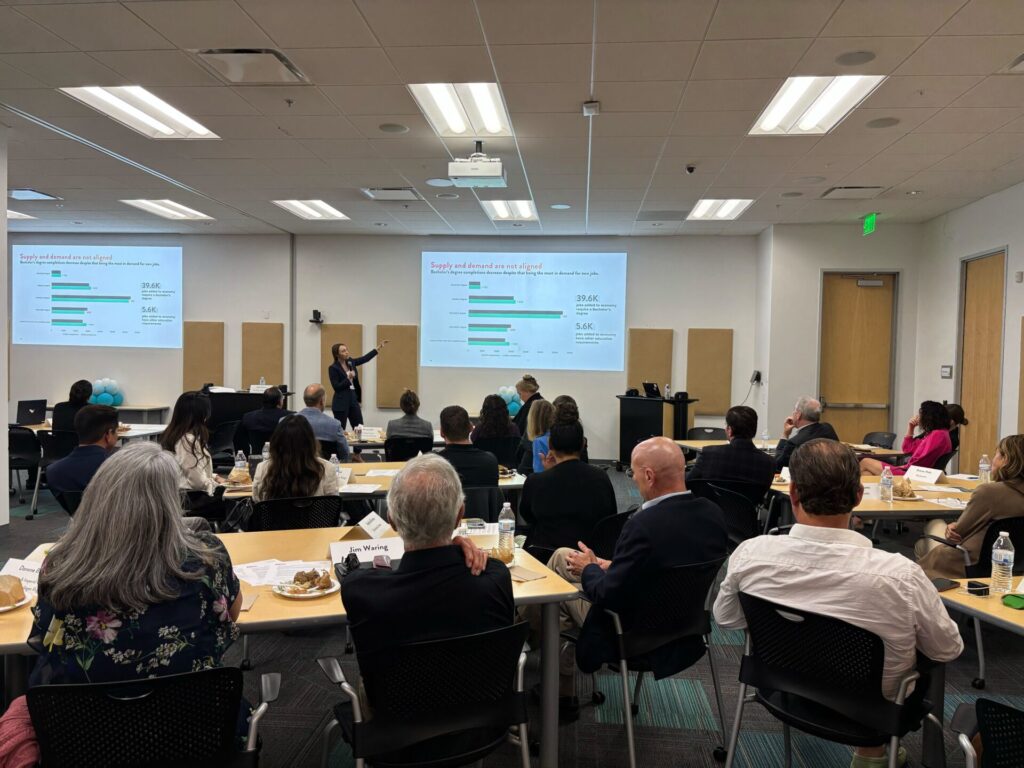
Bachelor’s degree completions decrease despite that being the most in demand for new jobs
Talent is evenly distributed, opportunity is not
Despite being an epicenter for innovation and groundbreaking ideas, not all of San Diego’s residents have access to that innovation economy. Poverty disproportionately affects people of color, leading to barriers in educational attainment and the ability to compete for innovation jobs.
Additionally, shrinking high school class sizes mean that the portion of high school graduates going on to complete a post-secondary degree will need to increase for the region to meet its annual goal of 20,000 new skilled workers.
All of this is compounding to create a challenging hiring environment for employers. Even when the economy is facing higher levels of unemployment, the long-term trends around skill alignment and the need for more workers with a post-secondary education remains constant.
As mentioned before, one potential solution is for the region (and the country) to invest in more ways for learners to obtain industry-recognized degrees and credentials. Credit for prior learning or experience, dual-enrollment, and generally improved alignment across education systems become critical.
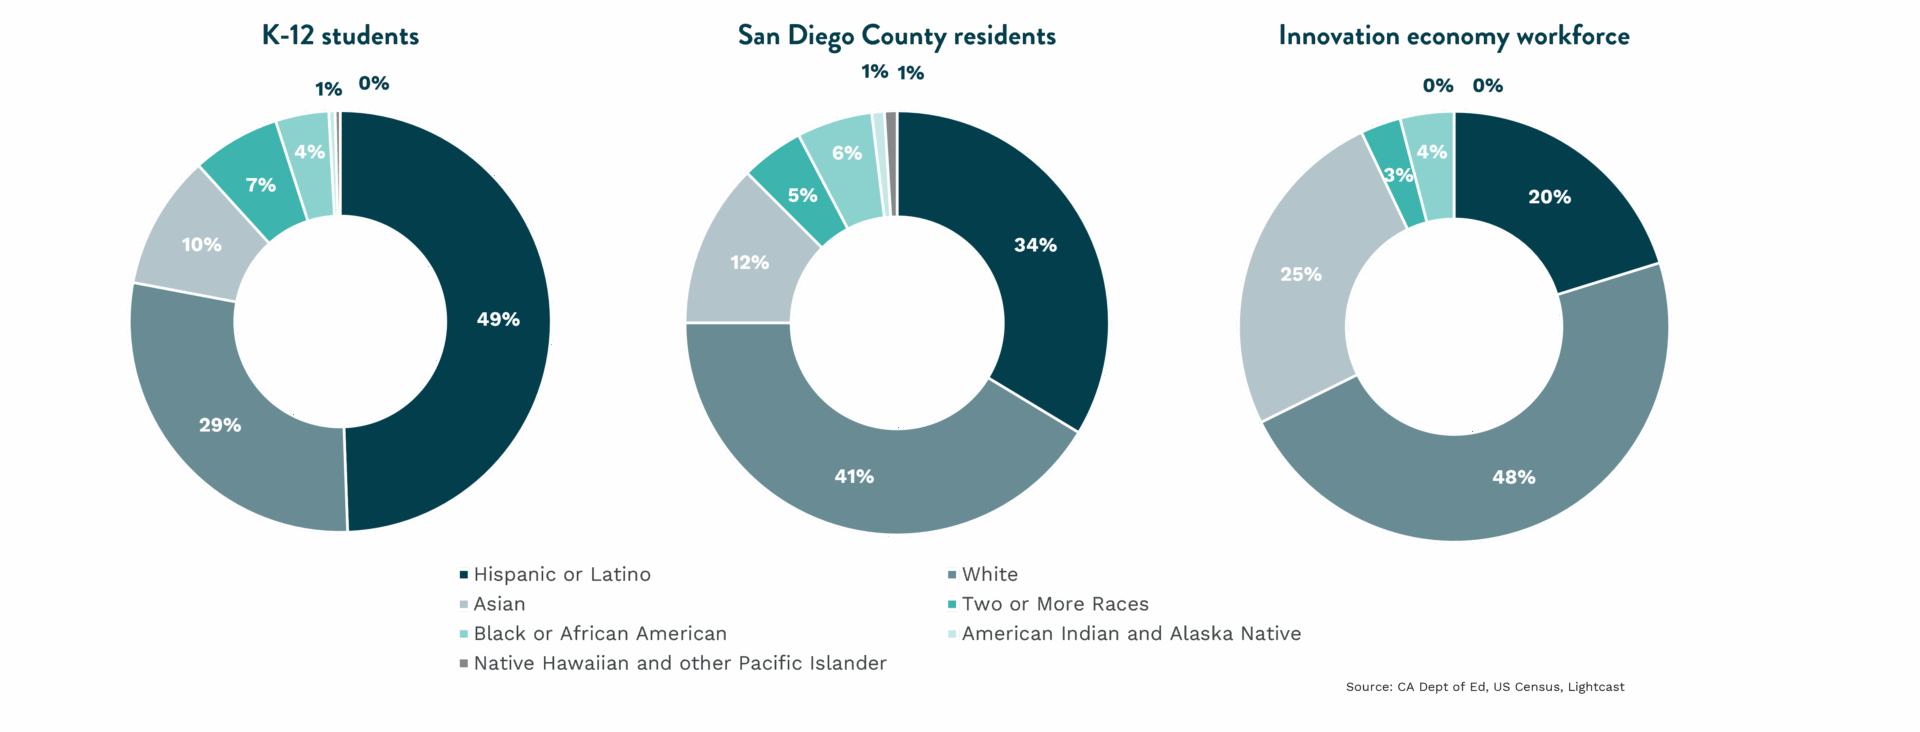
Innovation economy demographics are not reflective of regional demographics, or the workforce of tomorrow
Addressing the talent gap with strategic partnerships
During the May roundtable, a few partners were able to share how they are working to integrate the education and work journeys for participants.
Companies like Vertex Pharmaceuticals, in partnership with Junior Achievement of San Diego County, offer high school internship programs to support students in exploring the professional world and understanding their career aspirations before ever leaving the K-12 system.
The community college system is working with employers like GKN to build an apprenticeship hub the enables more earn-and-learn models without the headache that often comes with standing up a registered apprenticeship.
Organizations such as Family Health Centers of San Diego have been exploring loan forgiveness as a retention tool for staff, while ASML is investing in internal upskilling to support employee advancement and long-term workforce development.
Call to action
EDC cannot do this work alone. Progress on the 2030 Inclusive Growth goals is only achievable with and through the region’s employers scaling innovative and intentional solutions. If you want to be a part of the incredible group of organizations that are carrying the torch to 2030, EDC invites you to endorse the goals, use data tools like our talent dashboard and the progress reports to tell San Diego’s story, and share with us how you are driving progress toward an Inclusive San Diego.
Also: EDC and Junior Achievement are surveying businesses to understand the benefits of hosting interns. If your San Diego company has recently hosted an intern, please share your insight.
New analysis quantifies jobs, housing, other economic impacts for forthcoming Sports Arena redevelopment
A new analysis commissioned by Midway Rising and authored by San Diego Regional Economic Development Corporation (EDC) quantifies the projected economic and fiscal impacts of the Midway Rising redevelopment, which would revitalize nearly 50 acres of City-owned land in San Diego’s Midway/Sports Arena neighborhood.
With the addition of thousands of market-rate and designated affordable housing units, an entertainment district centered around a 16,000-seat facility, and a highly-amenitized urban park, EDC estimates Midway Rising will have a $285 million direct annual economic impact, equivalent to hosting another San Diego Comic-Con.
“This project is more than just a redevelopment—it’s a long-term investment in San Diego’s future,” said Mark Cafferty, President & CEO of San Diego Regional EDC. “As our region and state grapple with a dire affordability crisis, Midway Rising promises meaningful and accessible housing options, as well as a world-class tourism and entertainment hub that will add jobs. This is exactly the type of bold, private economic investment San Diego demands.”
Midway Rising’s more than $3.9 billion redevelopment will remake the nearly 60-year-old, City-owned Sports Arena facility and surrounding parking lot in the Midway neighborhood, and includes 4,250 new homes, a new 16,000-seat arena, and 130,000 square feet of retail space.
The EDC analysis also revealed other economic impacts to the City and neighborhood, including:
172% increase in housing stock in the Midway neighborhood.
The building of 2,000 deed-restricted affordable homes below 80 percent Area Median Income, which is the single-largest affordable housing project in California’s history.
The staffing of 3,100 permanent jobs paying 12 percent higher average wages relative to the site’s current retail mix.
A doubling of arena visitor spending from $160 million to $344 million annually.
$1.4 million in new tax revenues to the City and $3.9 million in new tax revenues to the County each year.
Participation in the City’s Business Cooperation Program, which reallocates the full 1 percent sales and use tax directly to the City’s General Fund.
Throughout the 10-year phased build-out, total construction activity is estimated to generate $3 billion in gross regional product and $94 million in tax revenues within the City of San Diego, while supporting the creation of 21,900 temporary construction jobs.
Selected by the City in late 2022, the Midway Rising team is made up of affordable housing developer Chelsea Investment Corporation, sports venue developer and operator Legends, market-rate housing developer Zephyr, and The Kroenke Group, a real estate investment company led by billionaire and professional sports team owner Stan Kroenke.
Midway Rising is anticipated to break ground in late 2026 pending City Council approval later this year.
The EDC assessment was commissioned by Midway Rising in Summer 2025. EDC currently does not endorse specific ballot measures or candidates. From time to time, we provide objective research on the economic impact of specific measures or proposals such as this to better inform the public and policymakers on a project’s potential economic impact. If you are interested in working with EDC on customizable research, contact us.
At the top of each year, we try to look ahead to which trends are most worth tracking for the potential impact each can have on our local economy. We began 2025 watching AI and affordability, as well as whether massive investments from both corporations and the federal government would translate into job growth.
We also began 2025 flagging that there would be many wild cards in the year ahead that could knock us off course. As we enter the second half of the year, we want to pause to take stock of what has been a very tumultuous six months, with both immediate impacts and long-term implications.
Affordability and AI
The housing affordability picture looks mostly the same as it did in January: dire. Mortgage rates have bounced around a narrow range while staying above six percent, and the median home price remains just above $1 million, translating to a monthly mortgage payment of about $5,300. This means the annual household income needed to qualify for a conventional loan is more than $260,000, which roughly 12 percent of all households in the region can afford.
Speaking of federal funding, the impact of federal investments on local job growth is more immediate. That’s because all the money that the federal government lined up to invest in re-shoring manufacturing, capacity building for semiconductors, and sustainable energy projects in the last few years has been cut off, significantly scaled back, or temporarily tied up. Oh, and don’t forget state and local public funding cuts.
It is worth noting that much of this remains to be settled as the courts figure out what the Trump administration can legally defund. Yet, much of it is already impacting San Diego’s economy.
New jobs data shows that through the first half of 2025, the region lost 4,900 jobs. This is not as bad as the first six months of 2024 but still trending in the wrong direction. June’s unemployment rate jumped to 4.9 percent (from 4.0 percent in May) as the number of people unemployed rose 14,200—the largest month-over-month increase since the pandemic lockdowns of April 2020.
Private sector job losses are even deeper, down 8,400 year-to-date. Every major sector in San Diego has shed jobs through mid-2025, with the exceptions of Healthcare and Social Services, Leisure and Hospitality, and State and Local Government.
Way too many wild cards in this deck
The pace of new policy directives from D.C. has been overwhelming. The lack of clarity as to whether these policy proposals will be implemented, or are legally enforceable, has been paralyzing. Whether it’s consumers, homebuilders, or manufacturers, the sentiment remains weak.
In San Diego, it’s not just bad vibes. The impacts are real.
The newly-created Department of Government Efficiency (DOGE)’s contract cancellations have started chipping away at our federal workforce, including DoD which spent $20 billion here last year. Proposals to reduce indirect costs associated with federal research grants have led to hiring freezes and layoffs in higher education and could evaporate nearly $448 million from the regional economy. The proposed cuts to NIH and NSF funding would nearly cut in half the region’s $1.1 billion that fuels the research that has led to 99 percent of drugs approved a decade ago. Congress’ latest tax law is set to increase the population of uninsured patients by 1.7 million across California and is already manifesting in workforce reductions at local hospitals, which hasn’t yet showed up in the data.
The up and down tariff threats are the top concern of local businesses that sell in global markets. As one company executive put it, retaliation from countries like China has “completely changed the growth strategy.” These impacts are felt locally in jobs losses to industries like Transportation and Warehousing (down 10 percent, year-to-date) and Retail (down almost five percent). These impacts are also felt by $1 billion less in venture capital, $500 million less in export sales, and 770 fewer employers looking to hire than a year ago in San Diego.
“If you want to go far, go together.”
There are many famous quotes about navigating uncertainty and how resilience drives success. At EDC, we often quote an African proverb: “If you want to go fast, go alone. If you want to go far, go together.”
Collaboration has often defined success in this region; it’s what makes us different.
Whether the winds change and we need to adjust our sails, or whether we fall seven times but pick ourselves up eight, let’s do it together.
As I look into my crystal ball again, I see the next six months will continue to be riddled with uncertainty and unexpected challenges. I also still see a region that is a top three Life Sciences market, a top three market for startups, has the largest concentration of military assets in the world, and the busiest land port in the Western hemisphere. So, we have a lot to build on. As your business works to navigate changing rules, reach new markets, or find talent, don’t go it alone. EDC is here to help.
Report: Gaps in accessibility challenge the region’s goals
Today, San Diego Regional EDC released its Inclusive Growth Progress Report, using the most up to date and available data (2023). With new progress and bold objectives set around increasing the number of quality jobs, skilled talent, and thriving households critical to the region’s competitiveness, the report measures San Diego’s growth and future outlook, and spotlights the greatest threats to prosperity
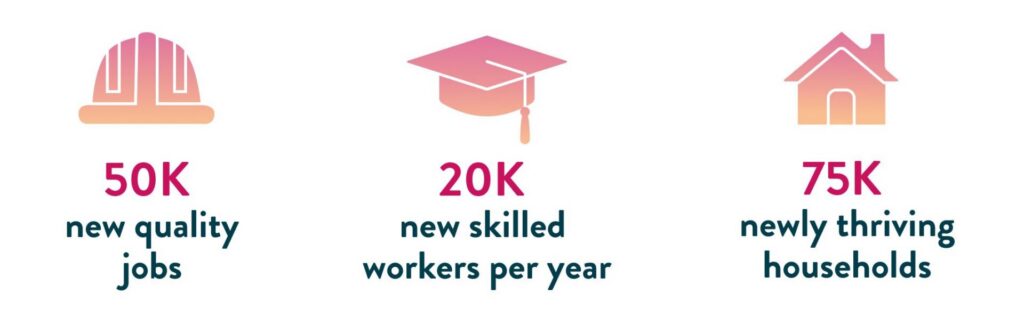
Making the business case for inclusion, EDC releases this annual report to track progress toward the region’s 2030 goals: 50,000 new quality jobs* in small businesses; 20,000 skilled workers per year; and 75,000 newly thriving households**.
Since its launch in 2017, the initiative has rallied public commitments from County, City, academic, and private sector leaders who are leveraging the Inclusive Growth framework to inform their priorities, tactics, and resource allocation. While much about the economy remains uncertain and inclusion is challenged at the national level, intentional and consistent efforts by a diverse set of regional stakeholders will be key to achieving these goals.
THE STORY BEHIND THE DATA
Halfway through the decade, the San Diego region continues to make progress towards its 2030 goals with increases in quality jobs, post-secondary education completions, and median household incomes in communities of color. Nevertheless, gaps in accessibility continue to challenge the region’s competitiveness.
In terms of quality jobs, San Diego has made immense progress towards the 2030 goal and is even projected to exceed it. However, while quality job numbers have increased, small businesses are struggling with a stagnant pace in job growth, talent acquisition, and staff retention. These challenges further the gap between small and large businesses and threaten small businesses’ ability to compete.
With many small businesses considering leaving the region due to funding and staffing challenges, it is vital that these firms have access to new markets. San Diego anchor institutions can make an immense impact by shifting just one percent of existing procurement spend to small, local, and diverse businesses.
San Diego’s innovation economy has positioned the region as a global hub for breakthrough scientific research and life-changing technological advancements. Yet, our talent shortage poses a threat to San Diego’s competitiveness and talent goal. A key issue continues to be accessibility for low-income students who make up the workforce of tomorrow but are underrepresented in today’s workforce. While Hispanic and Latino students make up almost half of San Diego’s K-12 students, only 20 percent are currently represented in the innovation economy workforce.
Furthermore, less than 40 percent of Black and Latino students from the graduating class of 2023 were considered college-ready upon graduation, which translates into less students opting into post-secondary education. This lack of preparation, coupled with the increasing requirement of a bachelor’s degree for entry level jobs, is exacerbating the talent crisis in the innovation economy. If San Diego is going to meet workforce needs and the talent goal by 2030, greater efforts must be made to enable access and opportunity for local, young, and diverse students.
With rising housing, transportation, and grocery costs, San Diego remains one of the most expensive metros in the country. While median household incomes have seen significant growth—especially in Black and Latino households—they still struggle to keep pace with rising costs. There is also a racial disparity in San Diego’s ratio of housing wealth to population share. For example, Latino households represent 27.4 percent of the population but hold only 17 percent of the region’s housing wealth.
While not at pre-pandemic numbers yet, San Diego has added 49,916 newly thriving households as of 2023, notable progress in the face of increasing affordability pressure. In order to sustain progress, housing options must be made available at more affordable price points, and housing permit activity needs to be accelerated to meet regional goals—especially for affordable and middle-income units.
The initiative is sponsored by Bank of America, Burnham Center for Community Advancement, County of San Diego, JPMorgan Chase & Co., Prebys Foundation, SDG&E, Southwest Airlines, and TOOTRiS.